Project Interface
The top toolbar has the following options:
Project Column

The first column also known as the "Project Column" has the following:
- Wokspace tab for woring on the annotator interface.
Jupyter tab for adding Google colab or jupyter notebooks to projects. More details in the Jupyter section.
- Users tab for viewing project user details and assigning cases
- Chat feature that allows you to discuss any issues with your team members
- Progress feature to check annotation progress of users
Export tab to download images, annotations, DICOM metadata and model outputs. More details in the Data section
- Info tab for project and dataset info
- Settings tab to change project settings
Community to access forums.md.ai
Docs to access our documentation at docs.md.ai
Labels Column
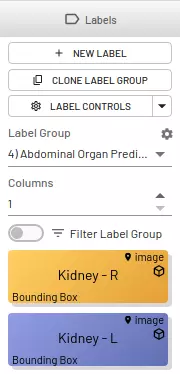
The second column shows labels that are available for your project and has the following features:
- Add new labels
- Clone Label Groups
- View labels
- Change label and label group settings
Global labels refer to an entire exam, series, or image. The global labels do not have any drawing associated with them. An example of a global label would be: "Normal Image".
Navigation Column
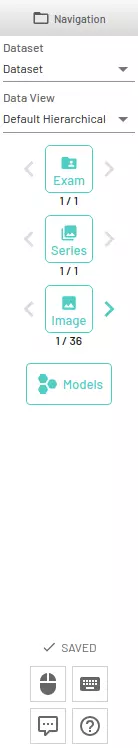
The third column is Navigation. You can easly navigate exams, series or images using this column. It has the following features:
- Ability to change the active dataset
Ability to choose from differnet viewing settings - Default hierarchical or Global Thumbnail.
- Navigate exams, series, images using arrows
Ability to deploy models for inference. This may or may not be available dependeing on your institution's MD.ai deployment.
- Keyboard and mouse shortcuts for easier usage.
- Ability to send feedback in case of issues/comments
- Help tab to access common troubleshooting tips Keyboard shortcuts and mouse button shortcuts are seen by clicking on the icons.
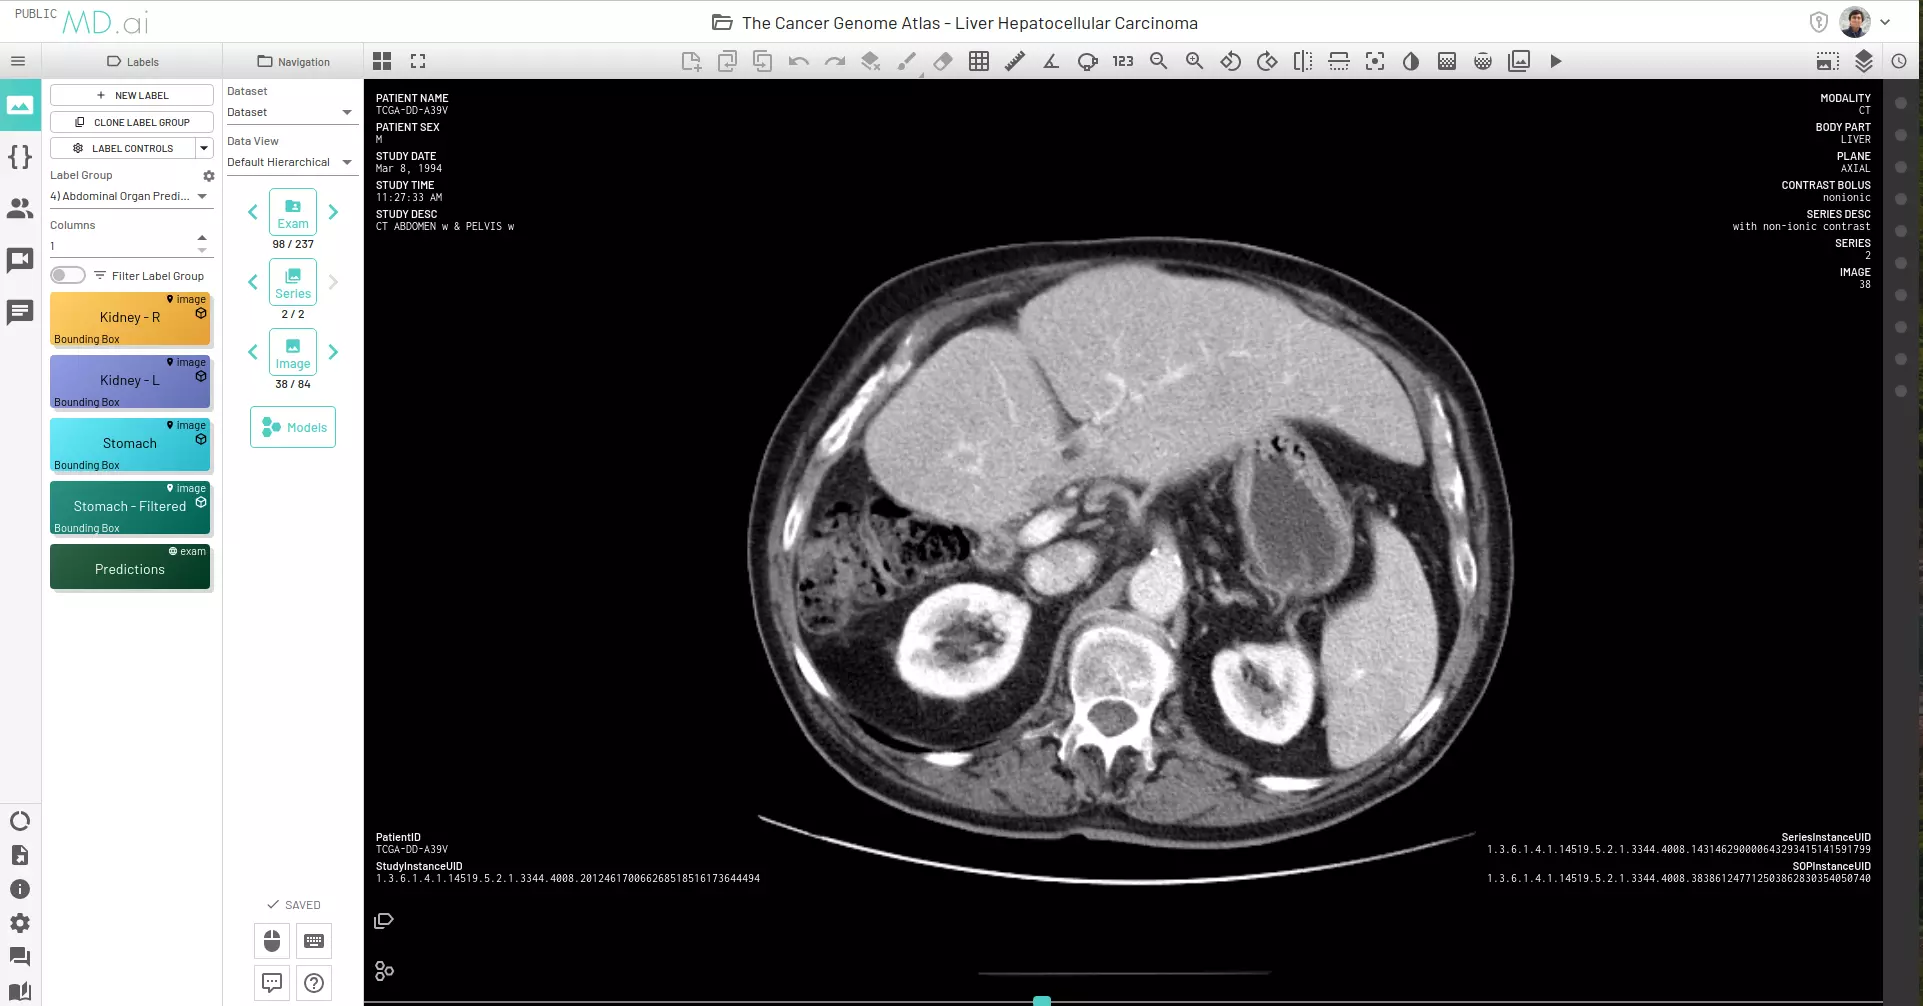
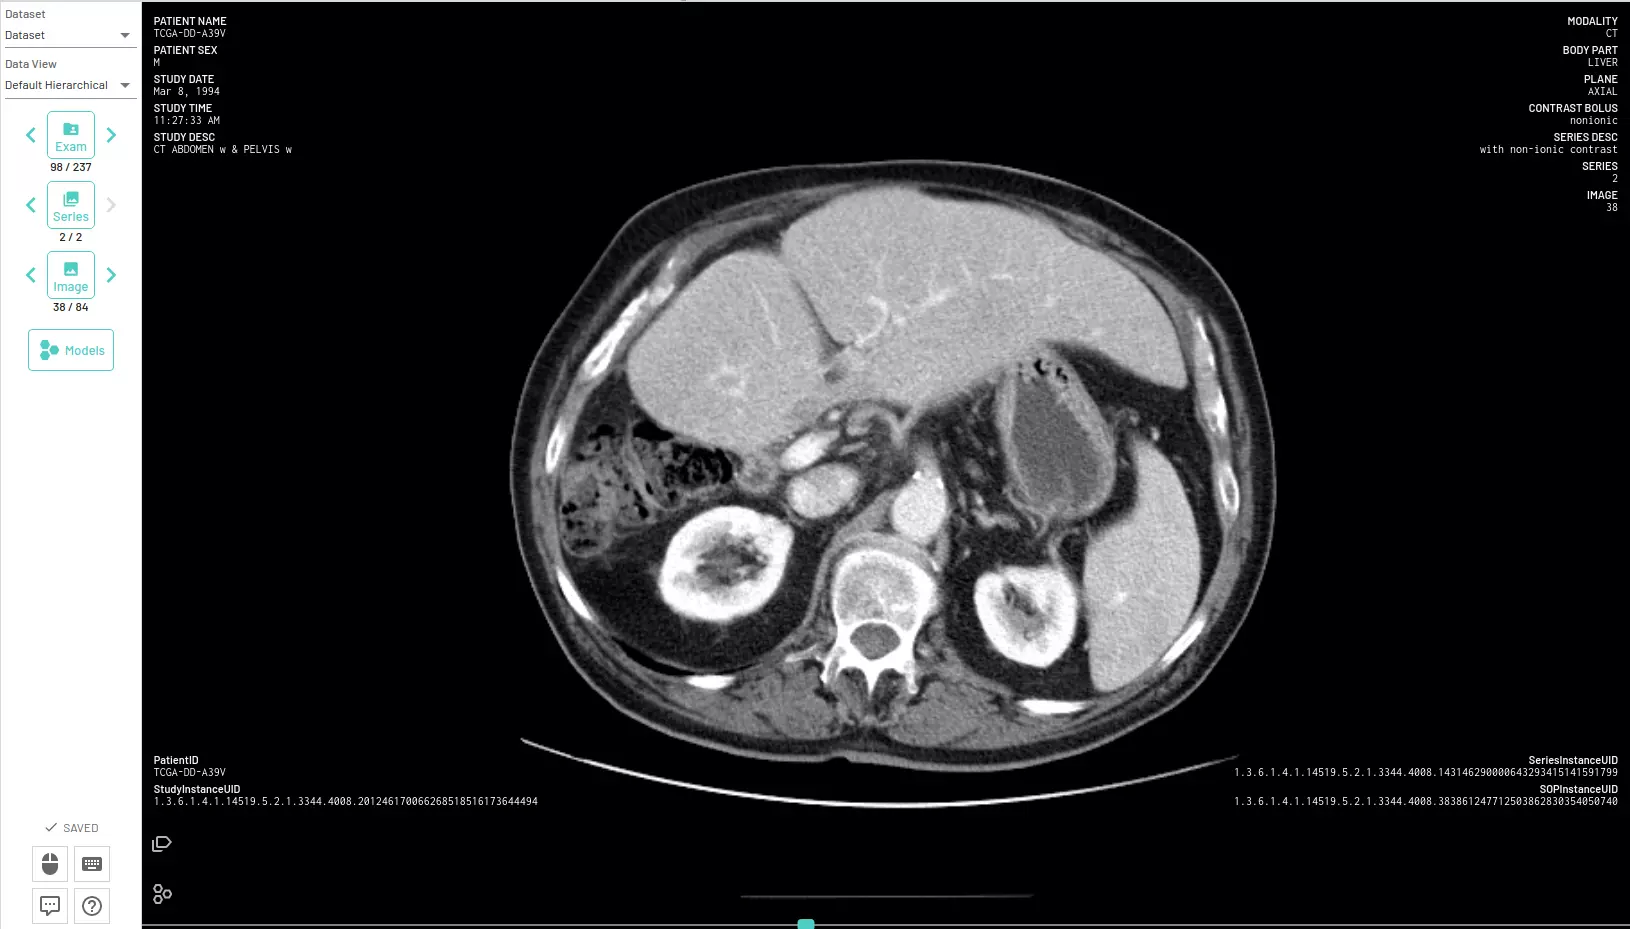
Image Column
The fourth column is the main portion of the annotator and shows the exams for annotation.
Updates Column

The fifth column is called Recent Events and keeps a track of all updates made to the project.
It shows annotations and the team member who created, copied, or modified them.
- Click on an event to jump right to that image and annotation.
- Click on header to minimize column width.
Top Row Buttons
Viewer Settings
View series or images in 1-6 viewers using several configurations.
You can also sync from two to six series for synchronized scrolling.
Series with different orientations will show reference lines for the non-active series. We also display the crosshair in synced viewers corresponding to the mouse position of the active viewer. All these settings can be toggled on or off from the Layers Control panel.
Sync
Reference Lines
Synced crosshair
Multi Planar Reconstruction (MPR) mode
Enable 3D multi planar reconstruction for any volumetric series. More details can be found here.
Fullscreen mode
Open the annotator in Fullscreen view.
Launch MD.ai reporting
Launches an instance of the MD.ai reporting and chat app withing the annotator interface on the left. This button will create a new report for the currently open exam or load an already existing one.
QR code for reporting
Launches a QR code to start dictating/creating a report using your mobile devices. Chanegs made on any devices will be synced to all devices on which the report is currenty active.
Add Notes/Tags to active annotation
Add notes or radlex tags to the currently active annotation. This option will not be available if no annotation is active. Notes are also displayed in the dedicated notes panel.
Copy the active annotation onto previous/next image
Copy the active annotation to the previous/next image. You can then edit, redraw, or remove the annotation independently. This option will not be available if no annotation is active.
Undo/Redo
Toggle recent changes.
Clear active Layer
Delete shape.
Brush Tools
The brush tools includes brush width and shape as well as an eraser for corrections.
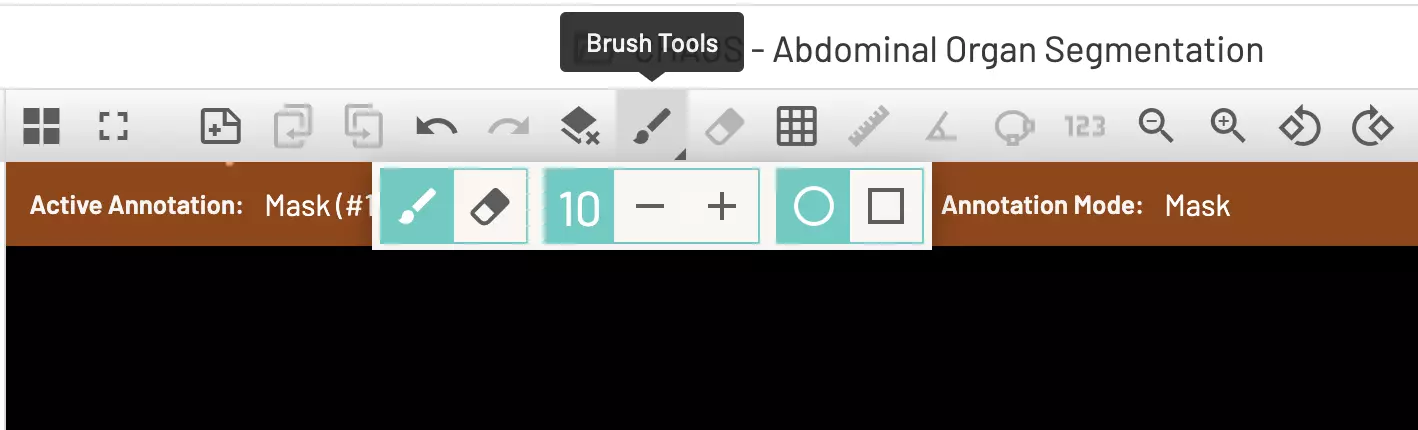
Erase
Will erase individual points on a freeform shape or polygon.
Grid
Display grid markers. You can choose a square or hexagonal grid. Adjust the size of the grid by using the grid size icon or by using keyboard shortcuts.
Ruler
Add ruler to measure in mm.
Angle
Add angle to measure angles in degrees.
Ellipse
Add an elliptical ROI tool. It includes the ability to rotate and get automatic diameter and circumference measurements. These elliptical tool measurements can also be copied to the clipboard for reference.
Pixel probe
Show pixel value for an individual point.
Zoom
Zoom image in or out.
Rotate counterclockwise/ clockwise
Rotates all images in series 90 degrees counterclockwise or clockwise.
Flip horizontal/ vertical
Flips all images in series along the horizontal/ vertical axis.
Center and reset viewport
Resets image viewport changes, including zoom, position, rotation, inversion, or window/level.
Invert colors
Inverts image colors.
Window/Level
Change window and level settings. There are also keyboard shortcuts to set window and level for CT scans.
ROI Window/Level
Automatically optimize window and level settings with respect to an area of interest on the image.
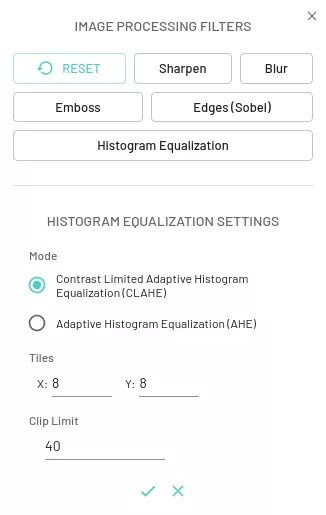
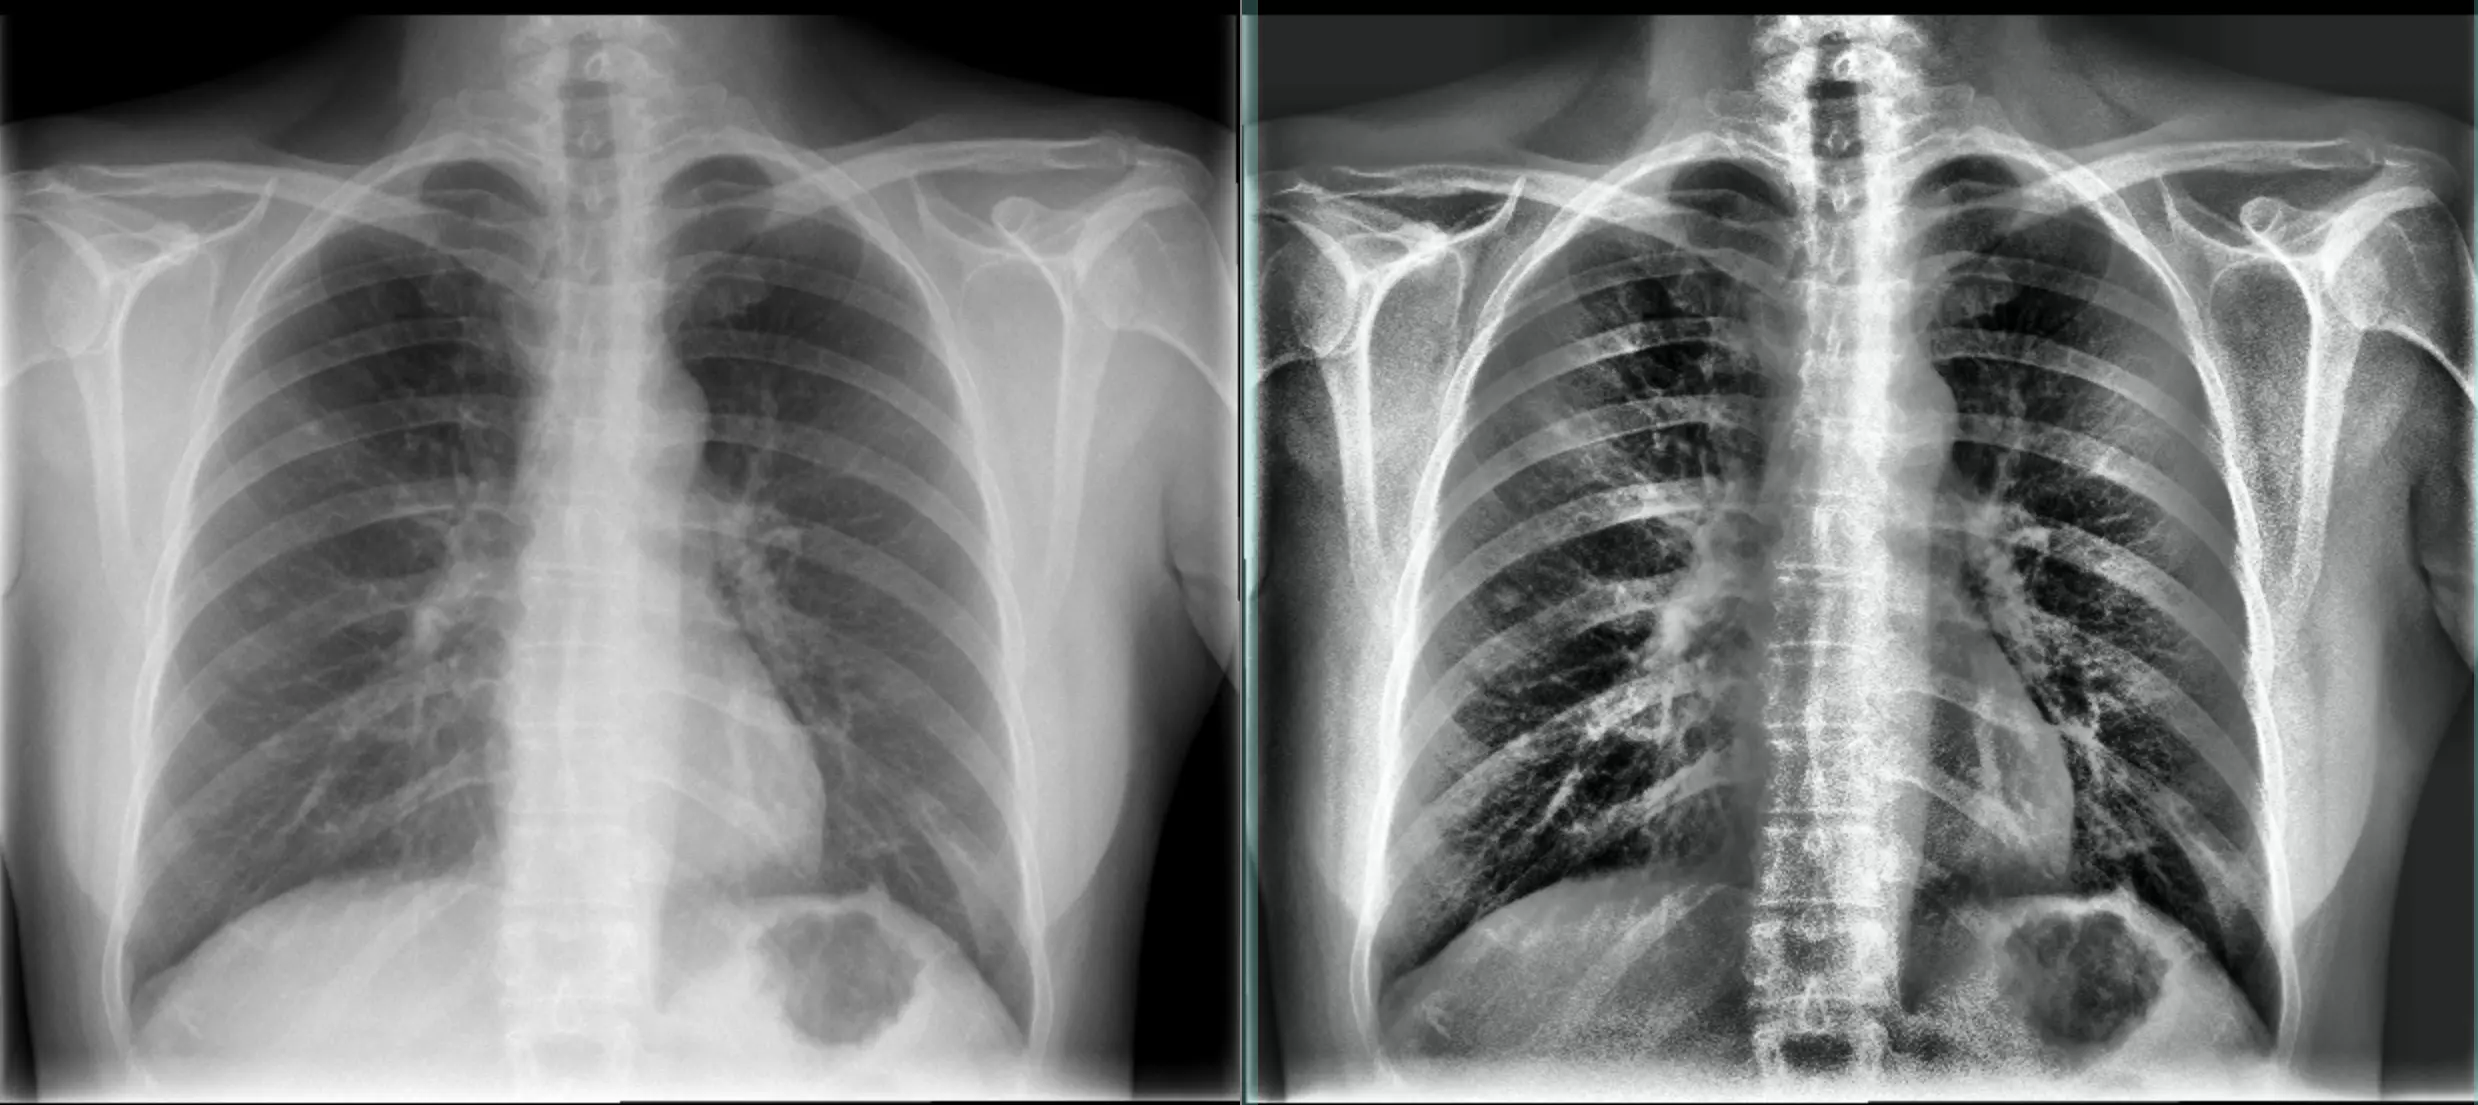
Image filters
Different image filters including sharpen, blur, emboss, edges (sobel) and histogram equalization
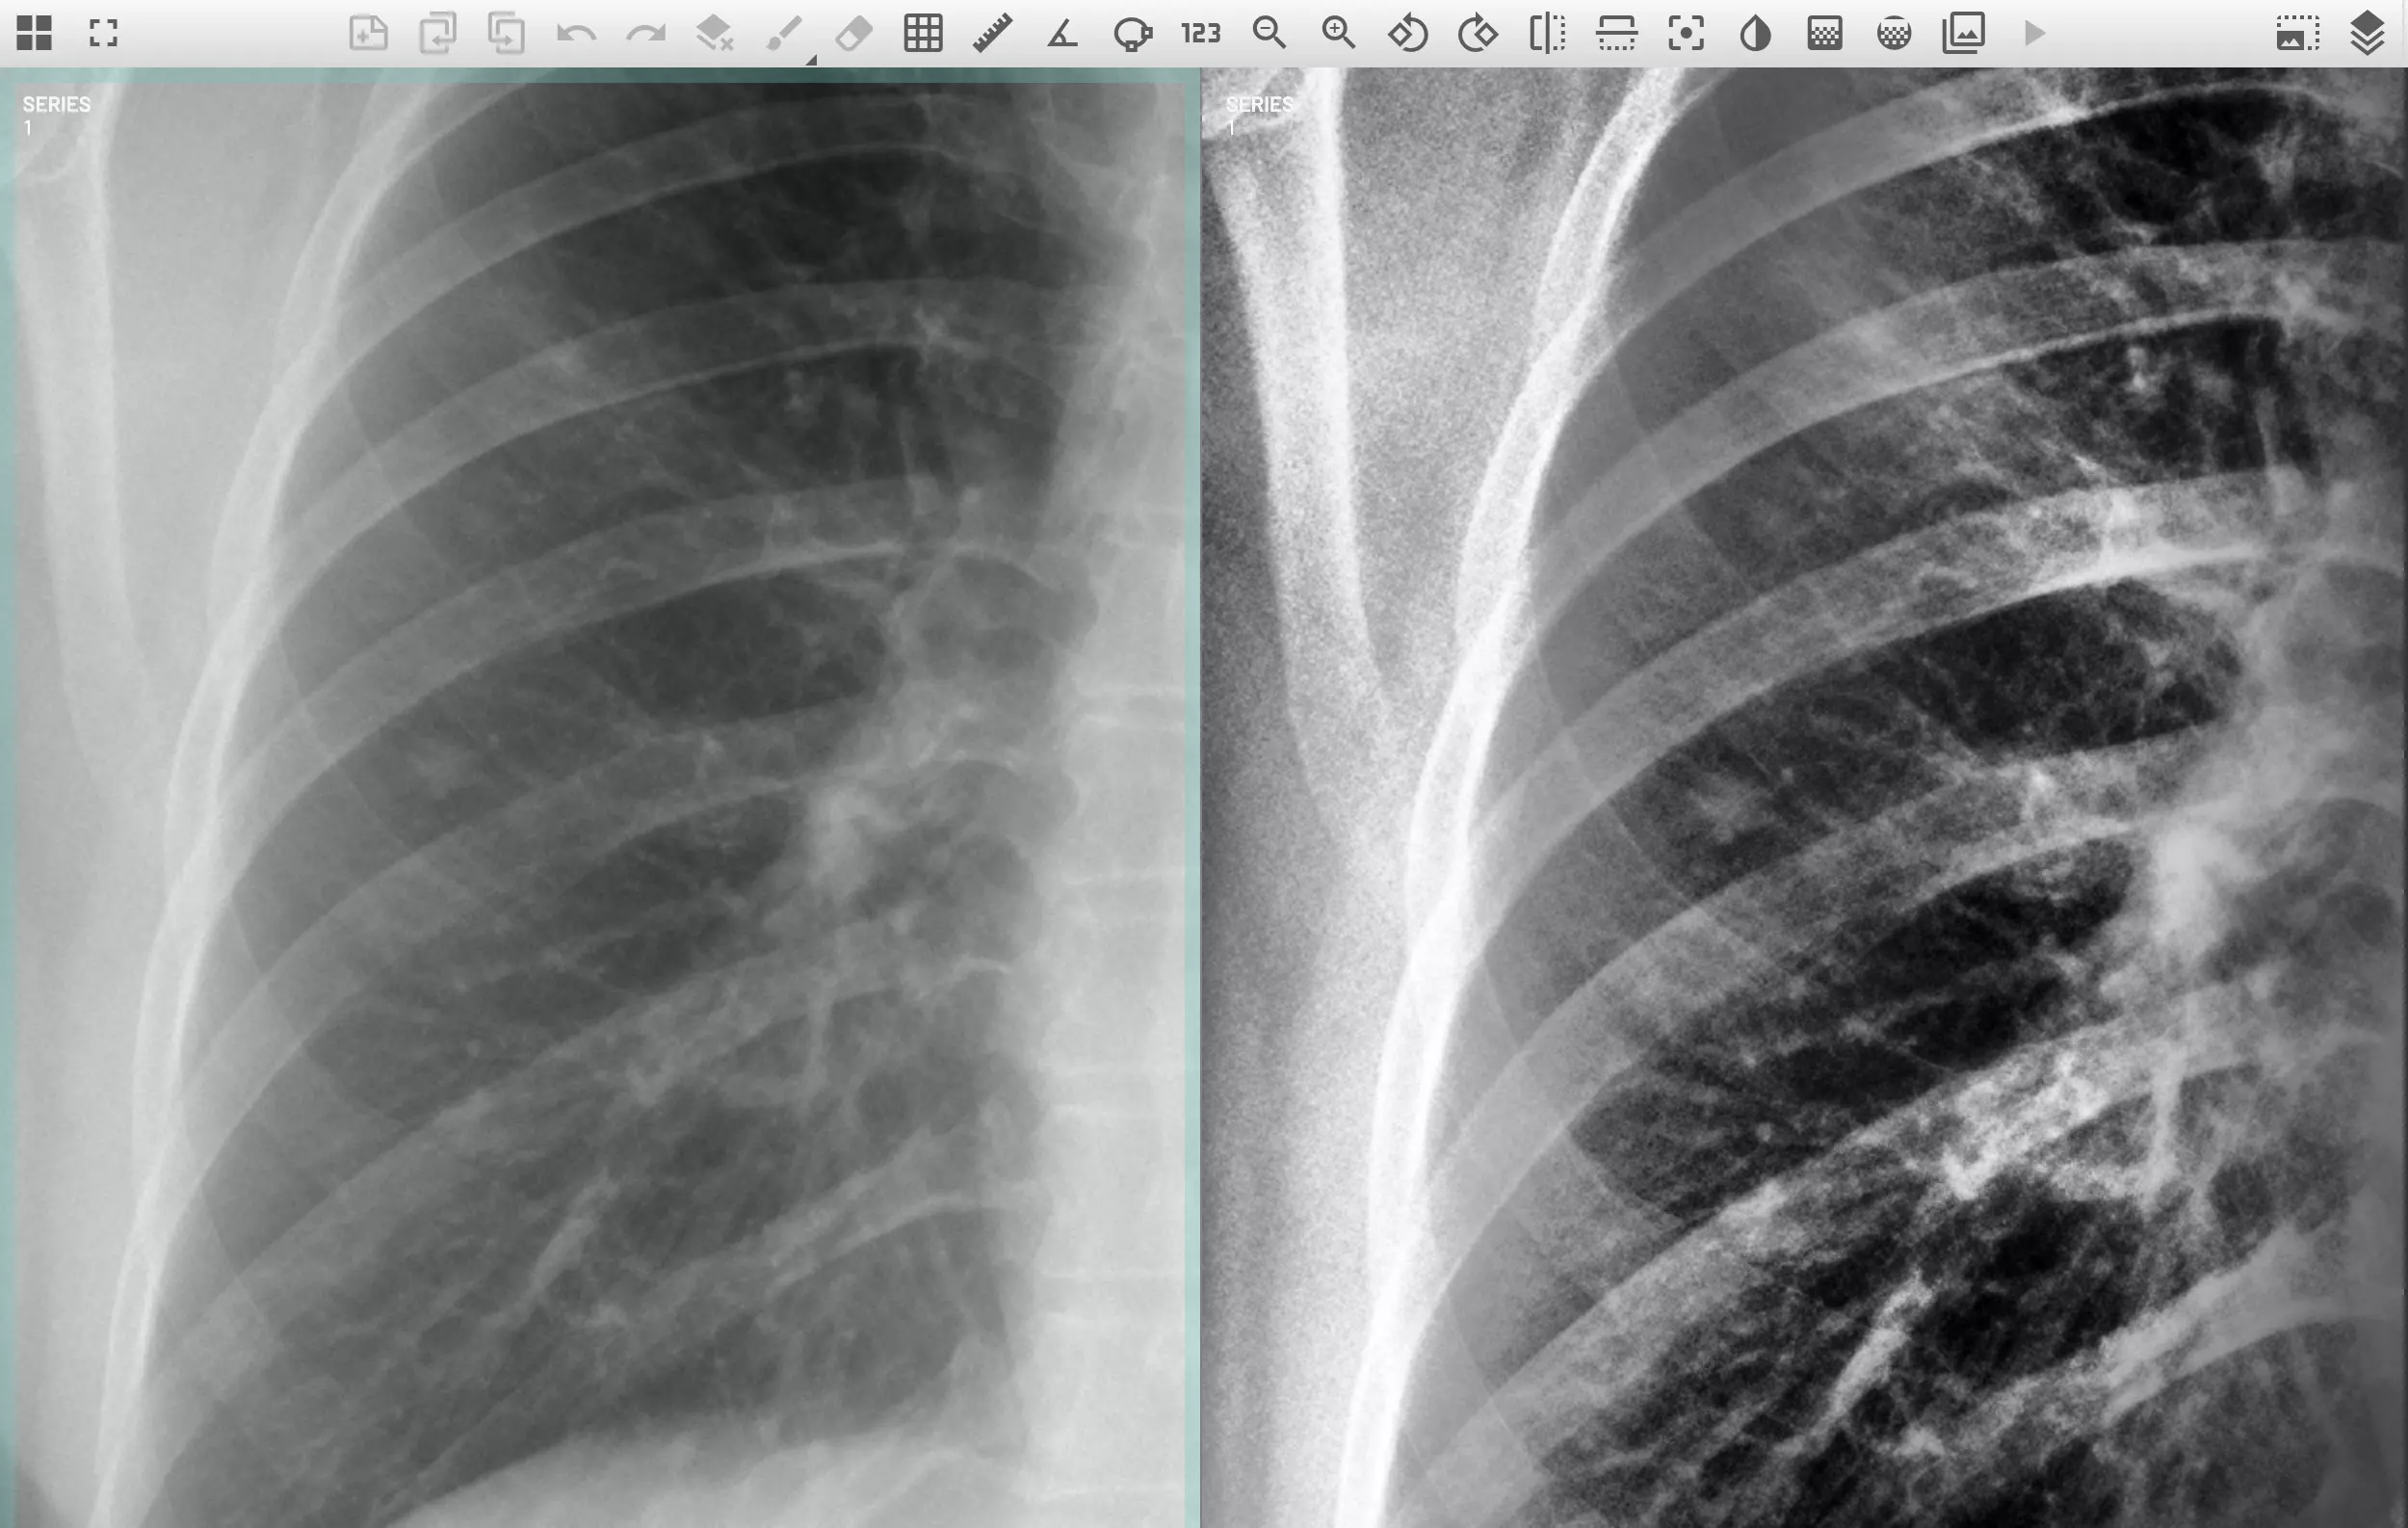
Example CXR before and after histogram equalization (CLAHE) to highlight a subtle lung nodule in the right mid lung.
Closeup of subtle lung nodule in the right mid lung.
Cine Play
Shows images in series in cine mode. Select the cine speed and direction.
Image Render Settings
Images are replaced with low resolution versions during scrolling and return to high res when scrolling or cine is stopped if you set Use Rendered Image on and set the Scrolling Image Resolution to Min. By default the scrolling image resolution will be set to Max for best viewing experience.
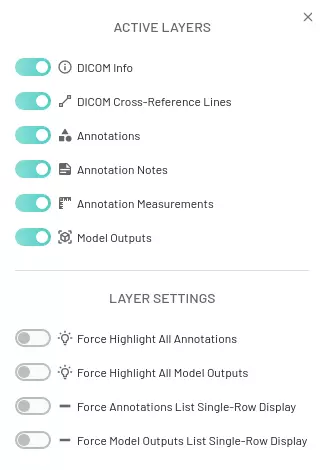
Layers control
Hide or show dicom information, cross reference lines, annotations, notes, measurements, and model outputs. Also options to show annotation/model outputs in a single row.