Model Performance
For classification models, you can click the Show Model Performance button from the model card title bar to easily visualize the confusion matrix, ROC curve, precision-recall curve along with their respective AUC scores. We consider a model to be a classfication based model if -
- It has at least two output classes.
- All model label classes are
Globalscoped.
Note
In order to show correct model performance metrics, you need to use the same label group for annotations as well as for the model outputs. Using different label groups will lead to model performance info not being displayed.

Settings
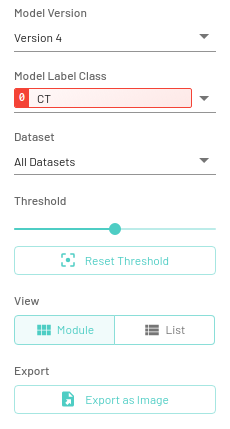
Model Performance settings determine what will be shown in the visualization card -
- Model Version: Select the model version to visualize, default value is the active model version.
- Dataset: Select at least one dataset to visualize. You can select multiple datasets or all datasets, defaults to
All Datasets. - Model Label Class: Select one of the model label classes.
- Threshold: Threshold for confusion matrix. Updating threshold settings will also update the data in the scatter plot and pie plot accordingly, default to 0.5, click the
Reset Thresholdbutton will set threshold to default value 0.5 - View:View the various plots either as a grid or select from the dropdown menu to view individually.
- Export as image - Download the model performance card as a png image for sharing externally.
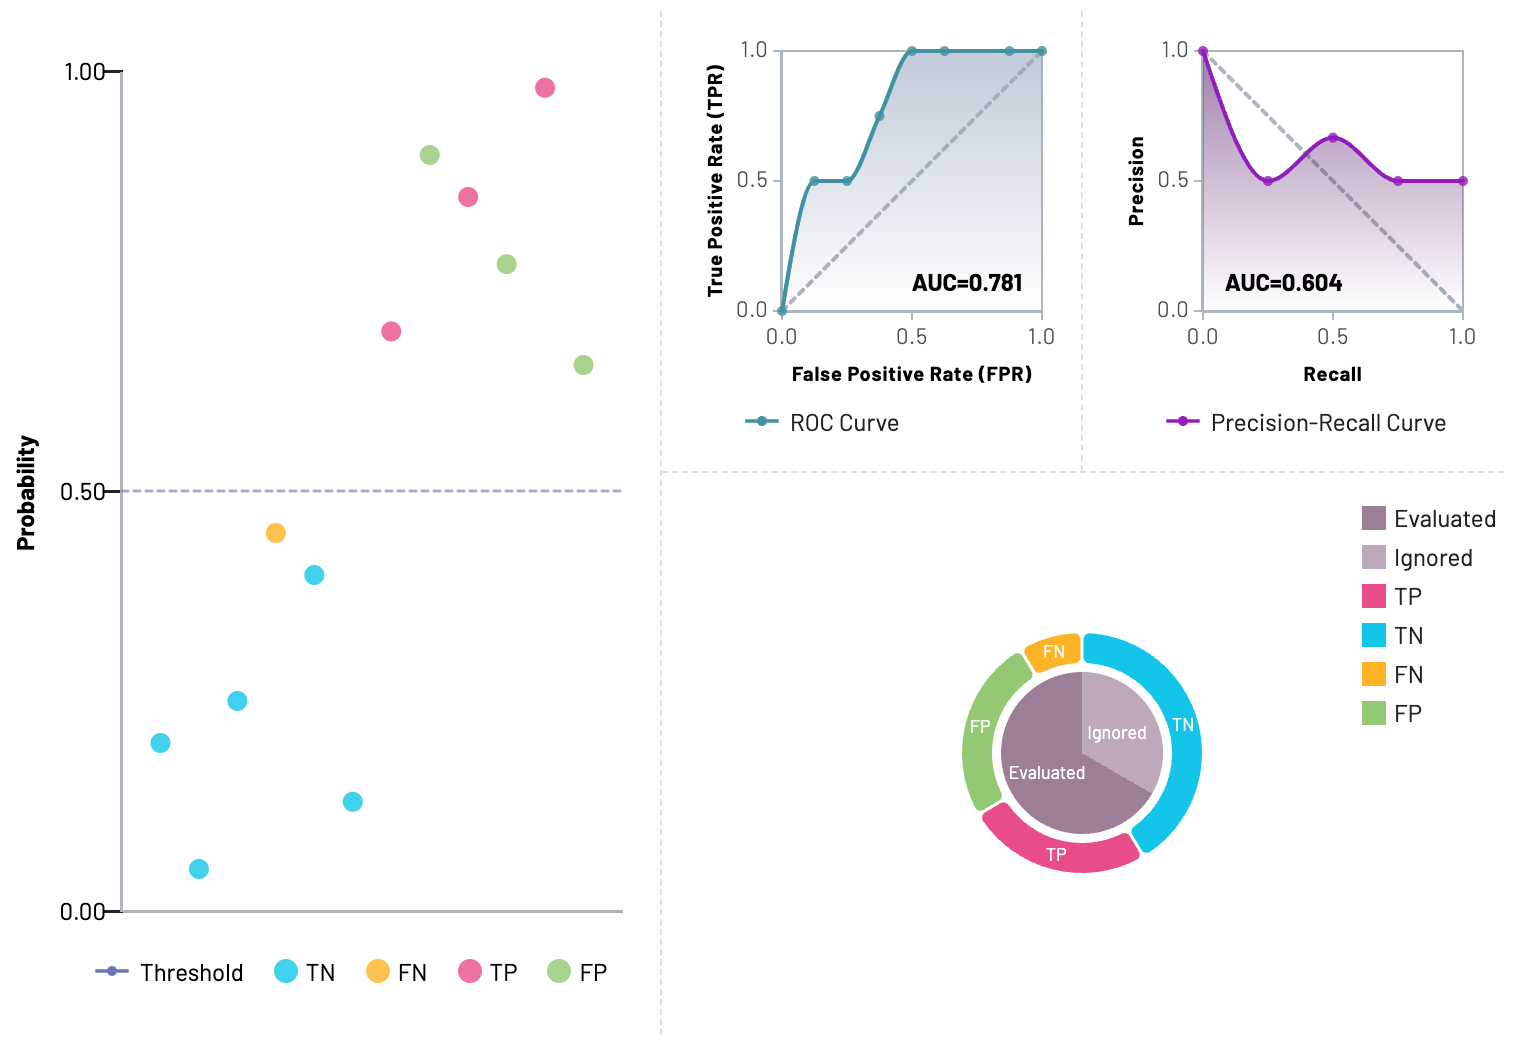
Visualization
The model Performance visualization area contains four parts:
- Probability Scatter Plot: Each scatter point represents the prediction for a given resource.
- ROC Curve Plot: ROC Curve and AUC score.
- Precision-Recall Curve Plot: Precision-Recall Curve and AUC score.
- Confusion Matrix Pie Plot: Confusion matrix (TP, TN, FP, FN) for all resources in the selected dataset. Can switch between
Evaluatedsection andIgnoredsection.
Resource navigation
The scatter plot points give additional information about a specific resource to help with error analysis. You can view and navigate to the exact resource (exam, series or instance) represented by the scatter point and also check its probability and confusion matrix values.
For binary classification, the best annotation will be shown in the scatter point card based on our annotation credit system, defined below. For multiclass and multilabel models, we show all possible annotations.
You can click the dataset item on the card to navigate to the dataset, or click the resource item to directly navigate to the resource on the annotator.
Note
Alerts will be shown in case the resources were deleted or you do not have view access to specific datasets based on the user assignment.
Model Performance for a Task
If you would like to visualize the model performance for a specific model Inference task, there is a View Performance button in the model task details panel for visualizing.
Calculation mechanism
Model performance calculation combines MD.ai annotations and model outputs. Below are some explanations to help you better understand how it works -
Assume there is a binary classification model with two label classes [0,Abdomen], [1,Chest], and you want to visualize model performance for the label Chest. If there is one DICOM instance with annotation Chest and model output Chest, this instance would be counted as a True Positive (TP).
If an instance has model outputs but without any annotation, the instance would be counted as No annotation and the total No annotation count would be displayed in the Ignored section of the Confusion Matrix Pie Plot.
If an instance has annotations but without any model output, the instance would be counted as No Output and the total No Output count would be displayed in the Ignored section of Confusion Matrix Pie Plot.
If an instance doesn't have any annotations or model outputs, the instance would be counted as No Anntation & Output and the total No Anntation & Output count would be displayed in the Ignored section of Confusion Matrix Pie Plot.
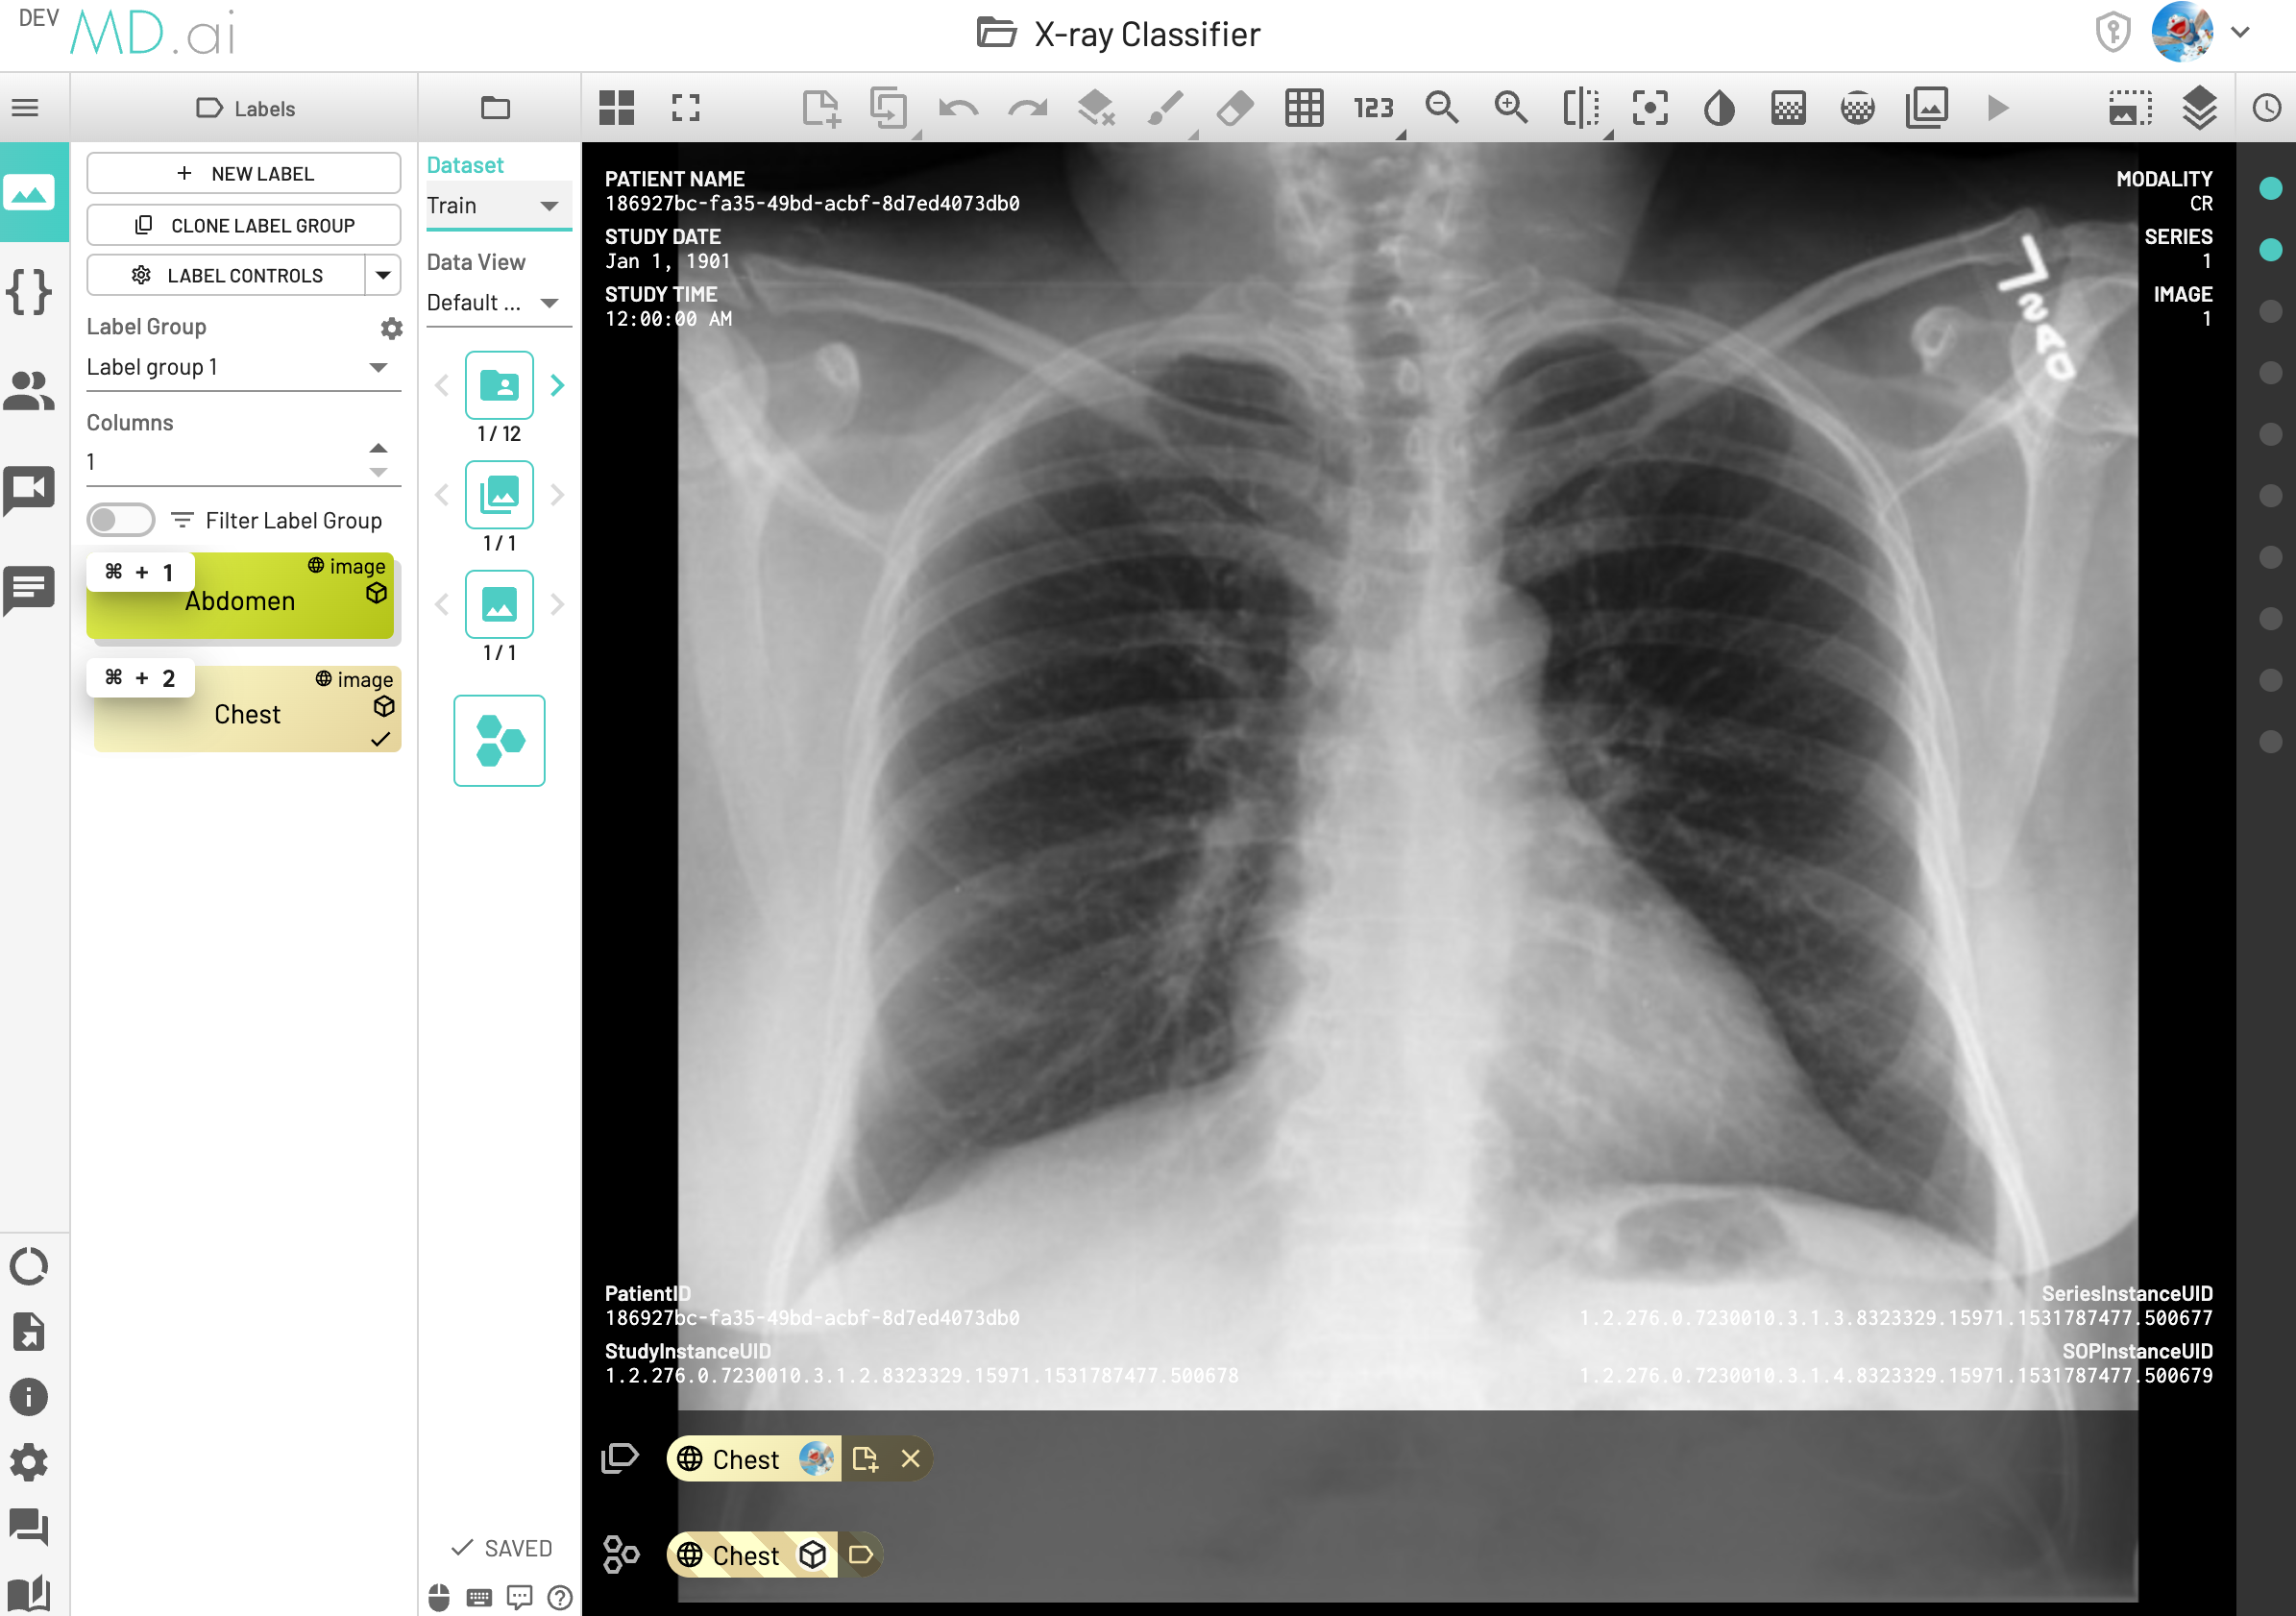
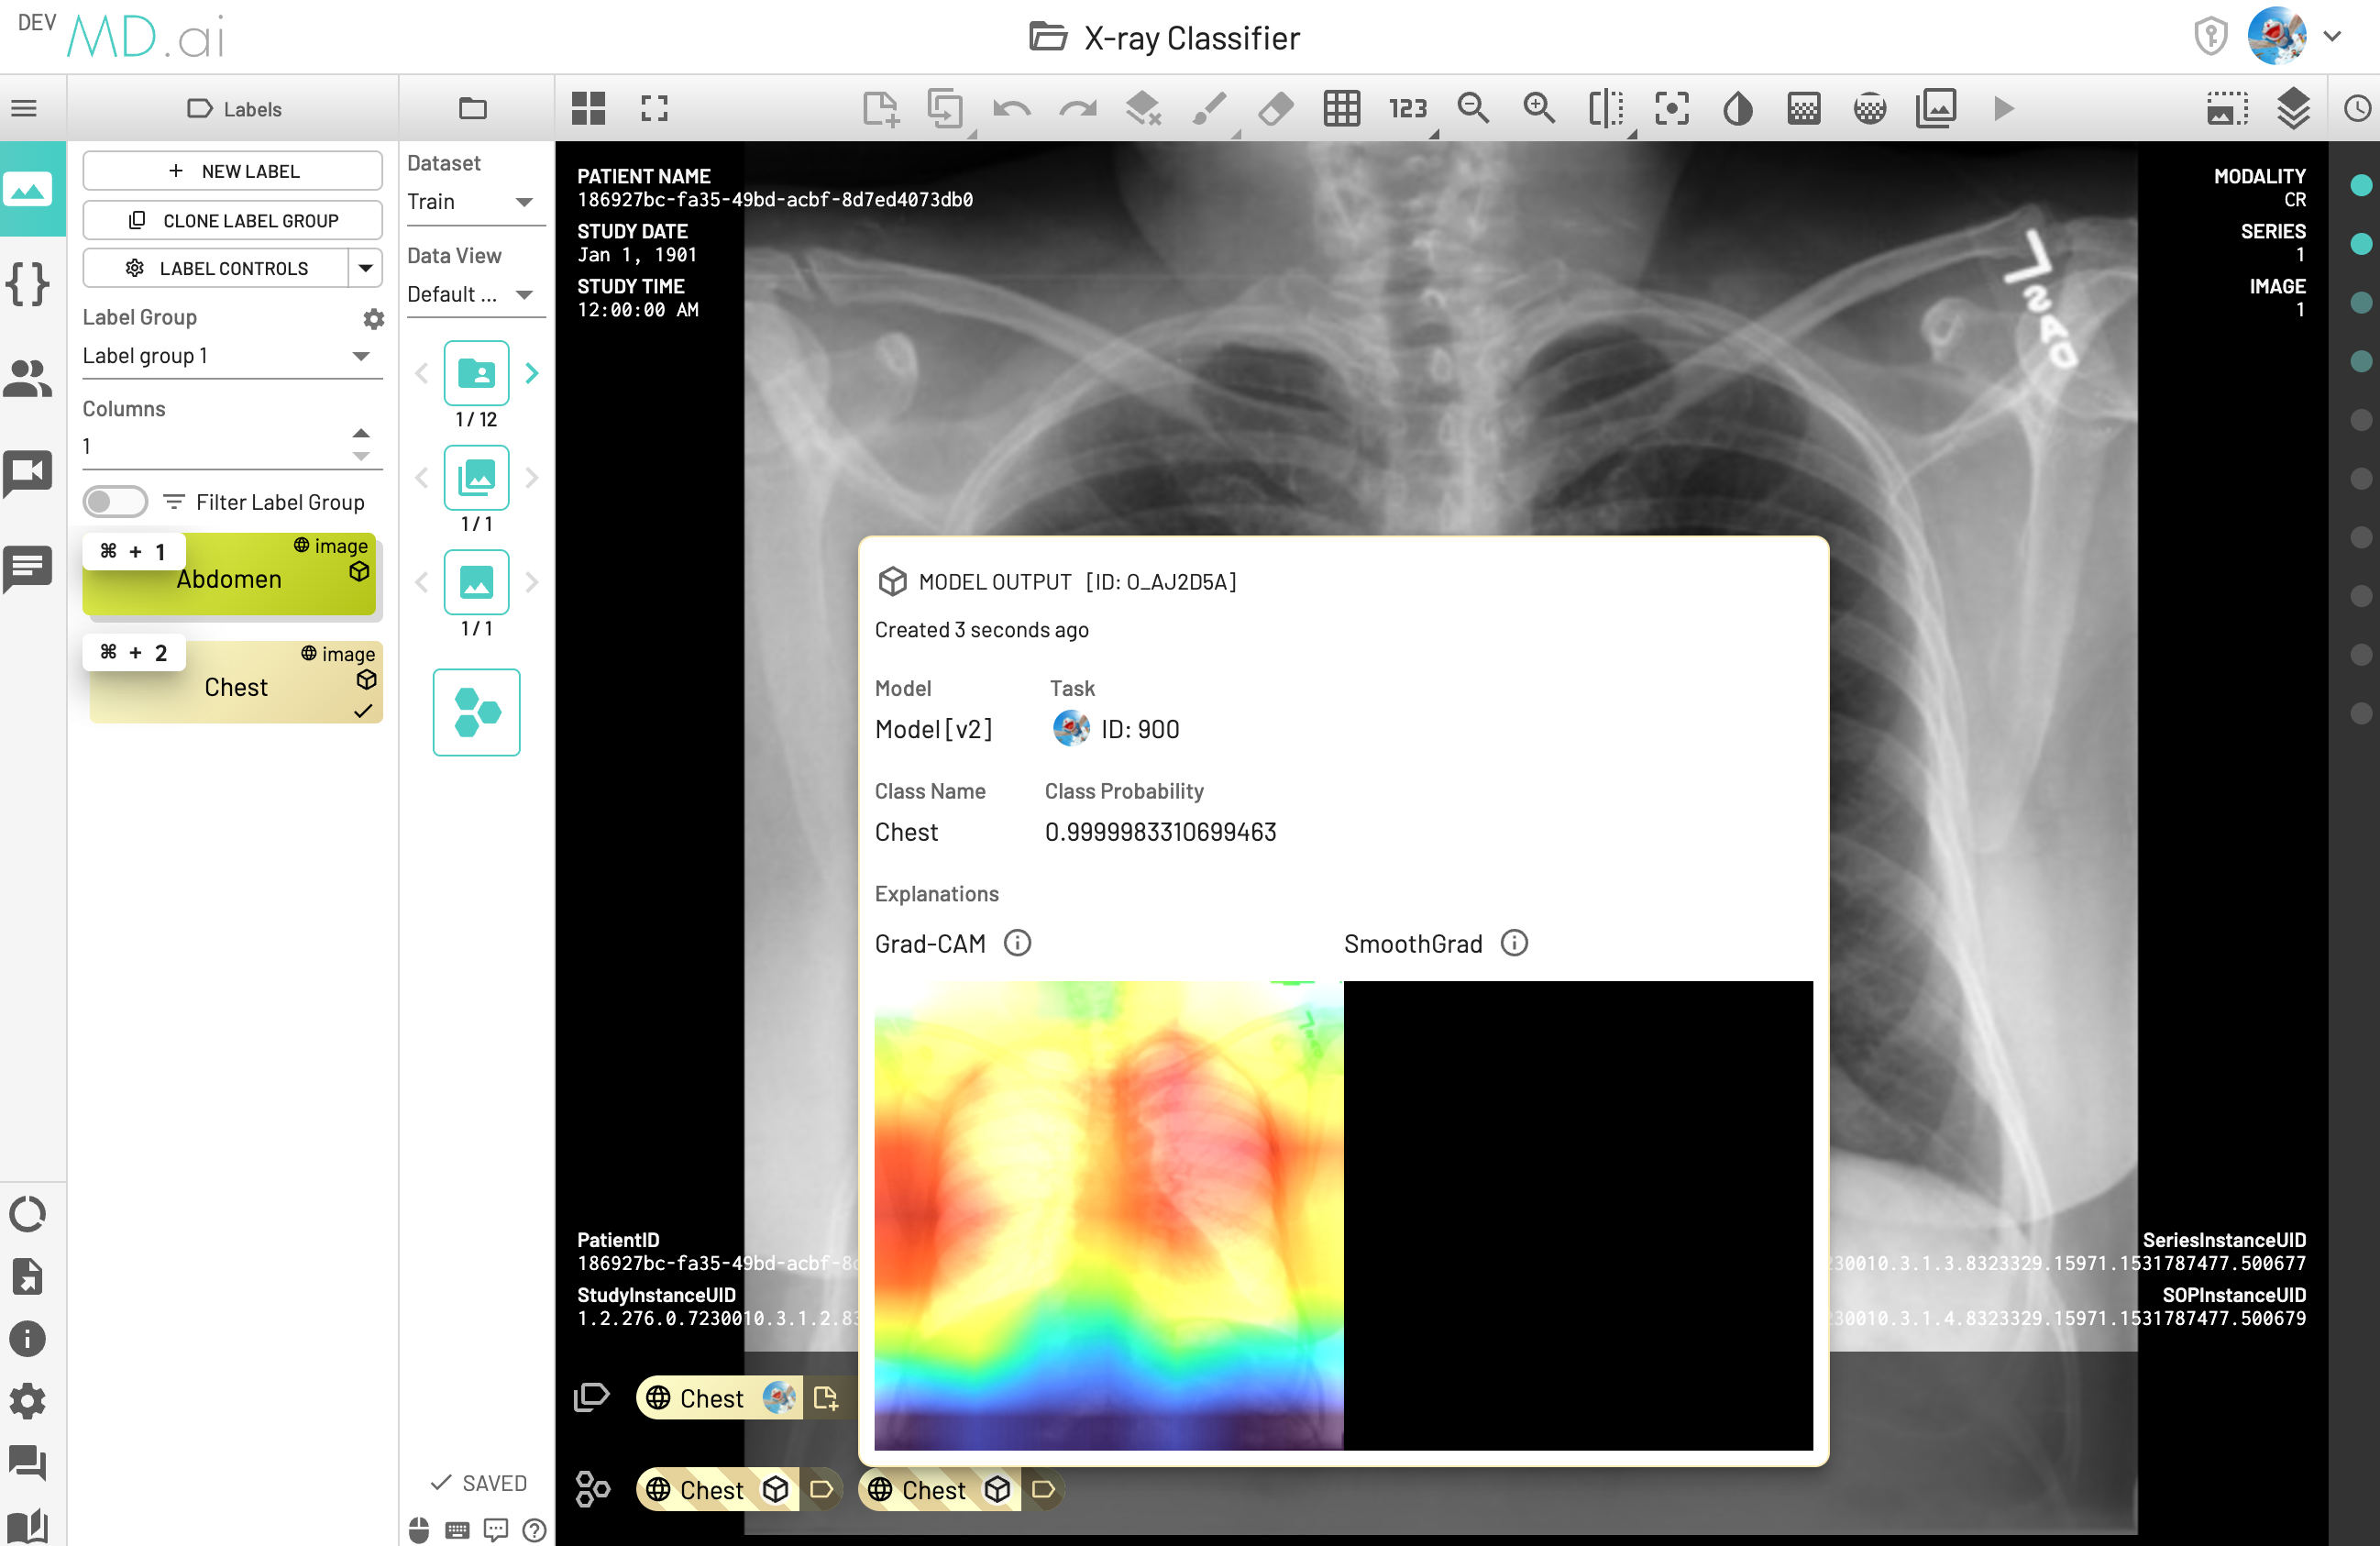
If one DICOM instance has multiple outputs from the same model version (for example, the model version was run multiple times to generate these model outputs), although the model outputs are the same, we pick the latest model output (in the following screenshot, the latest one is ID:O_AJ2D5A) for model performance calculation. This instance would be counted as True Positive (TP).
If one DICOM instance has multiple annotations, the annotation picking logic depends on whether the model is Single-output Classification Model or Multi-outputs Classification Model.
Definition of Binary/Single-output Classification Model
The model is classification based and all resources in the project have at most one model output from one model task.
For Single-output Classification Model -
-
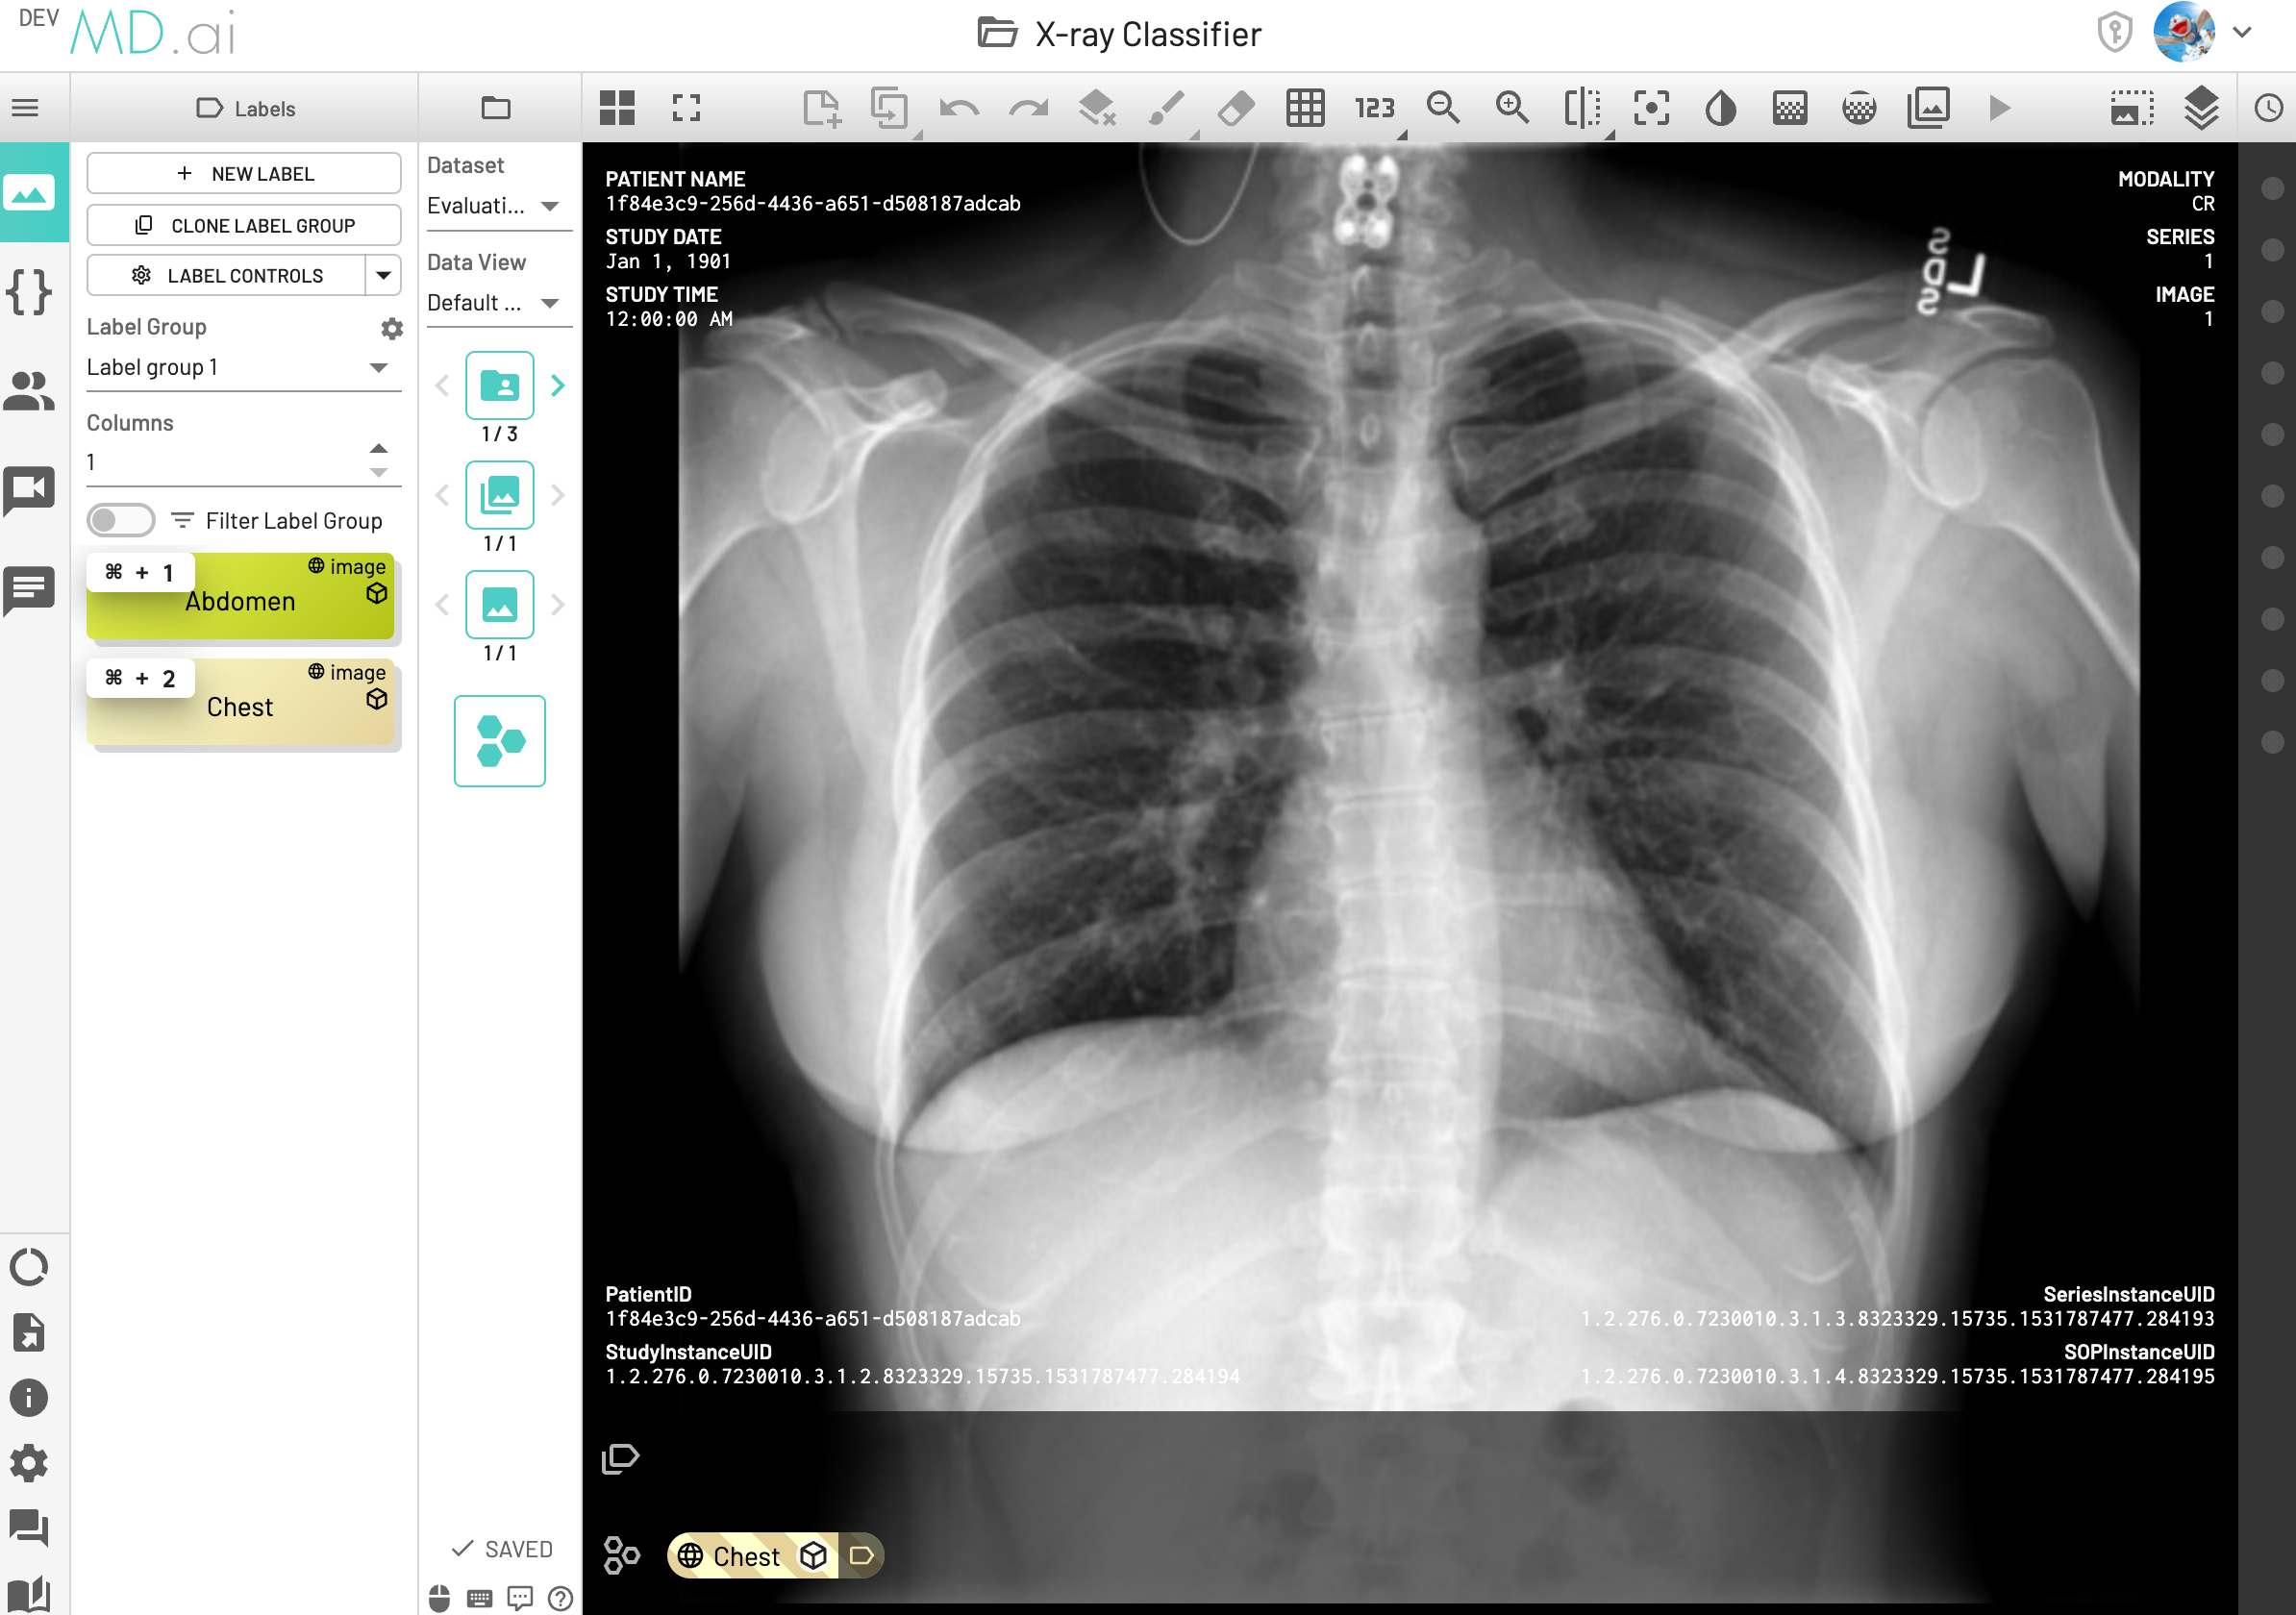
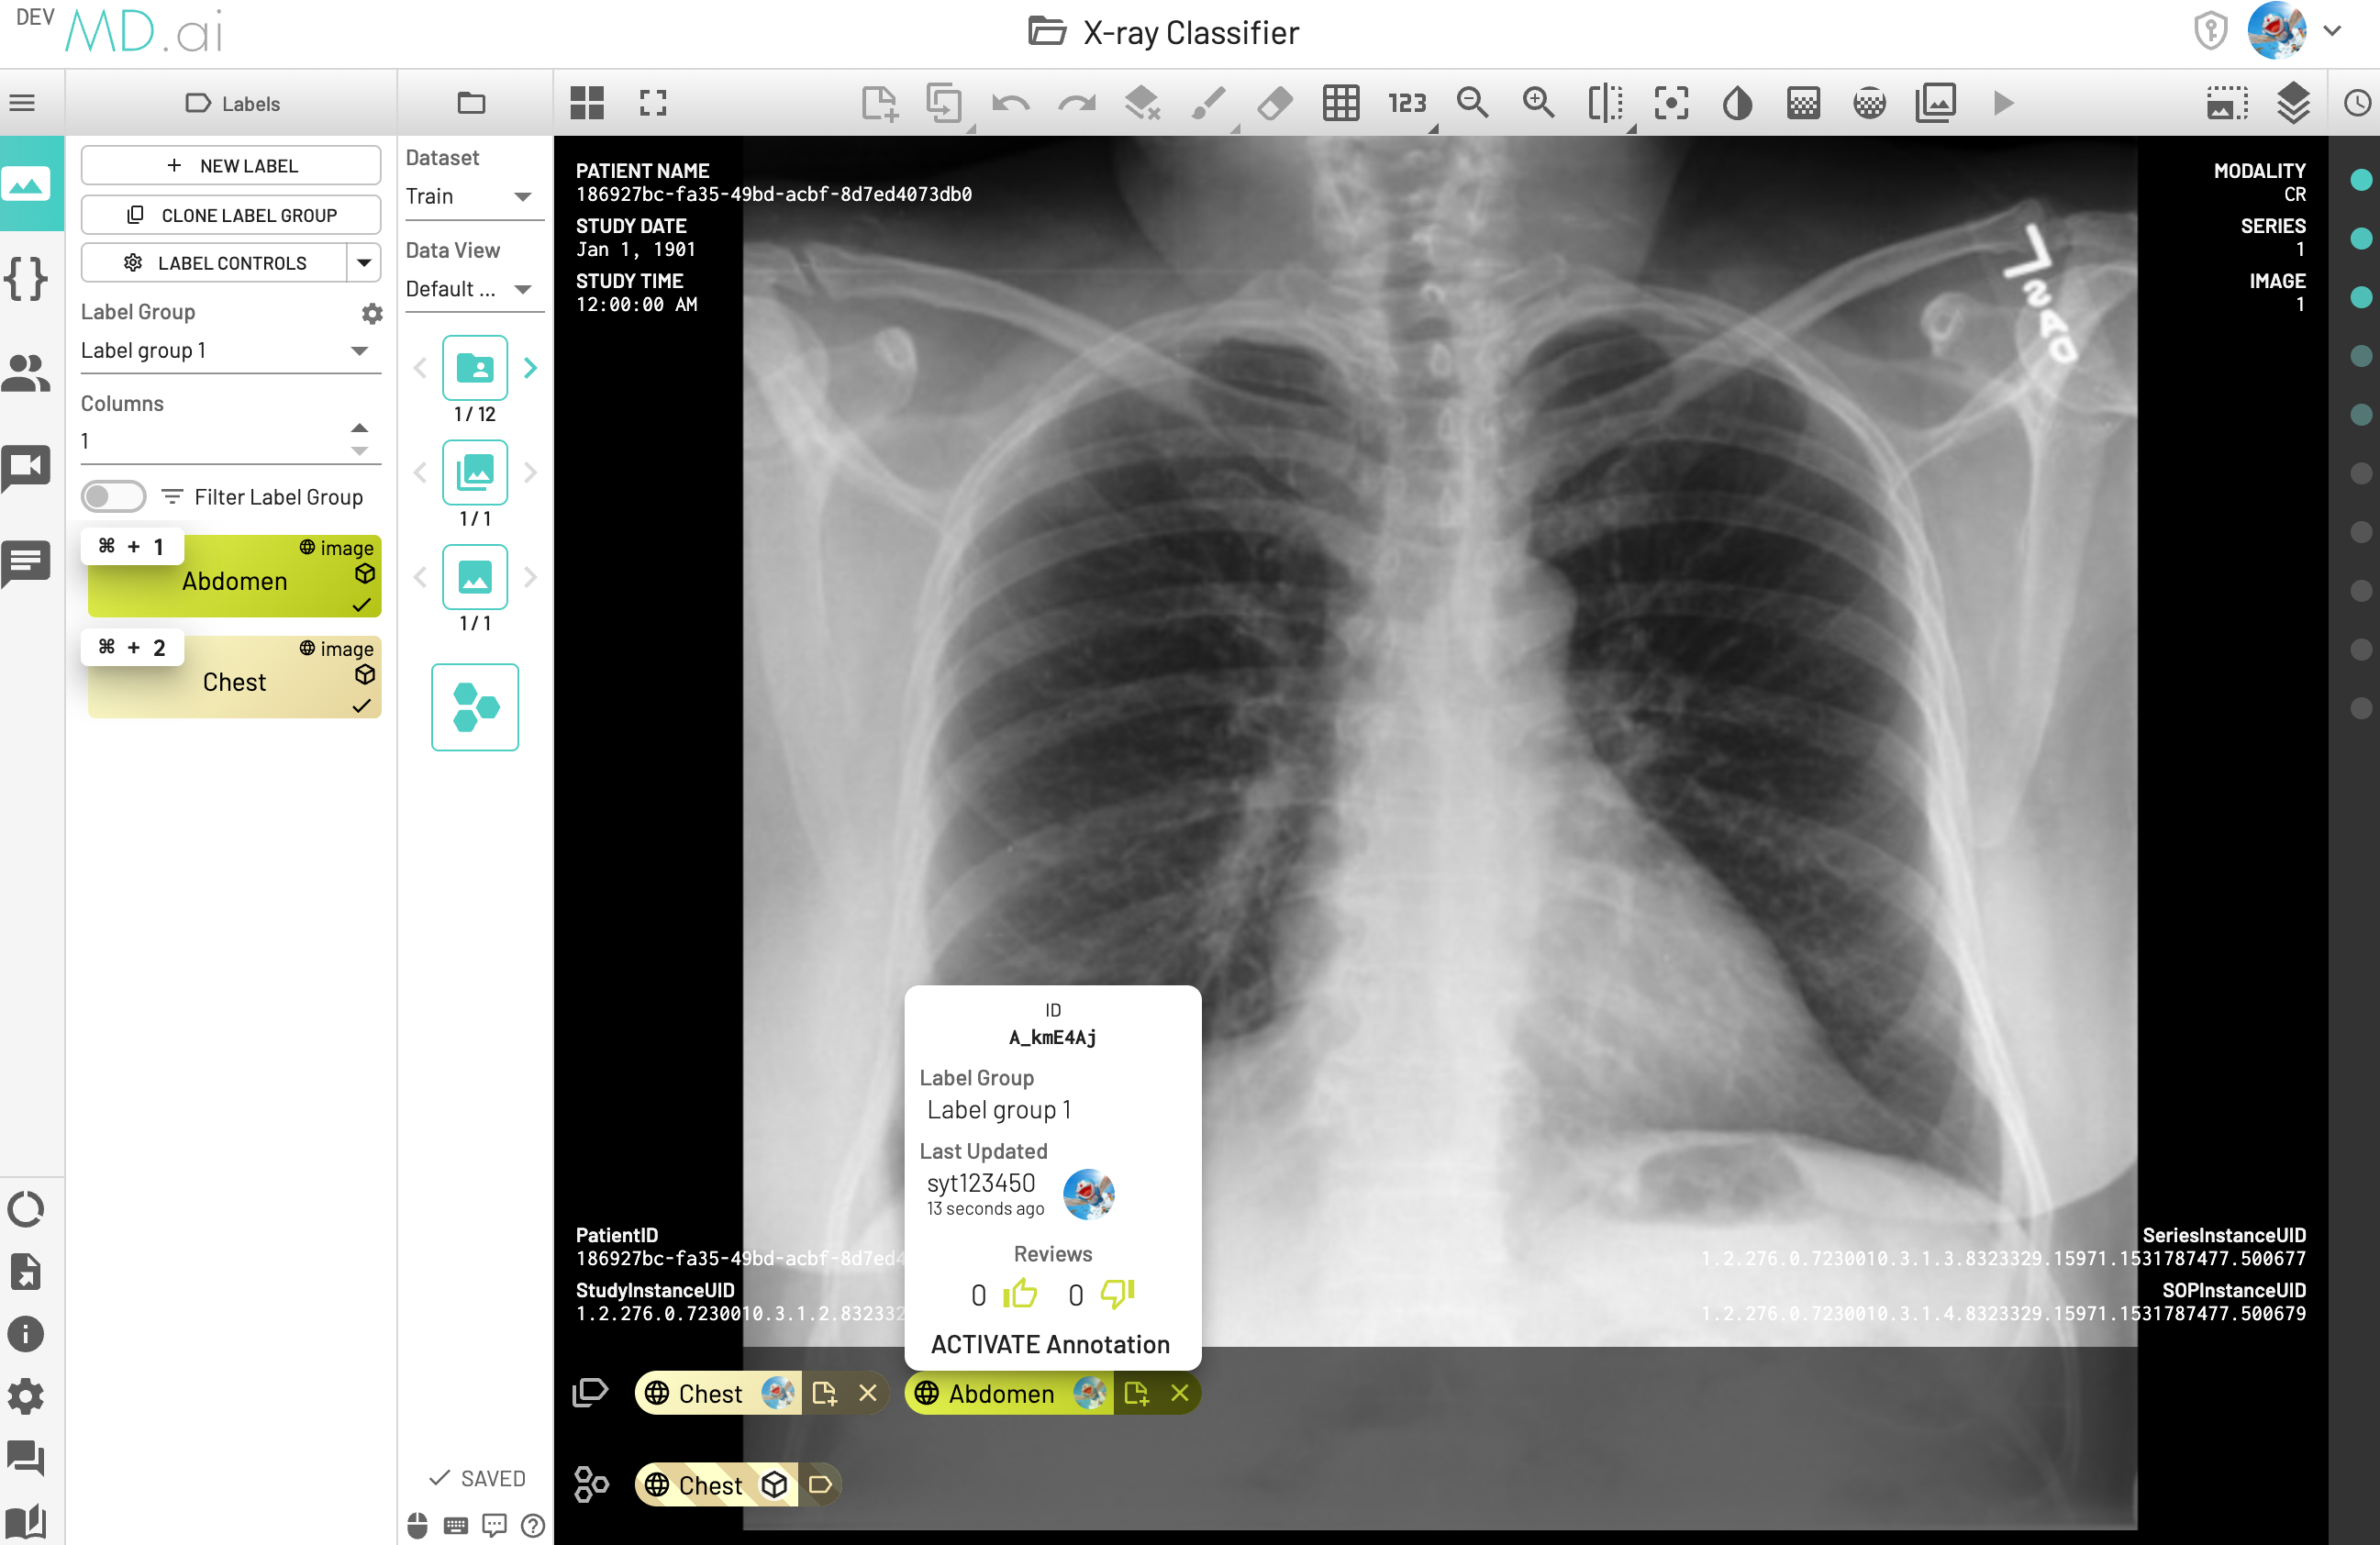
If
Creditof annotations are the same, pick the latest annotation (in the following screenshot, the latest one isID:A_kmE4Aj) for model performance calculation, which means the instance would be labeled asAbdomenand counted asFalse Negative (FN). -
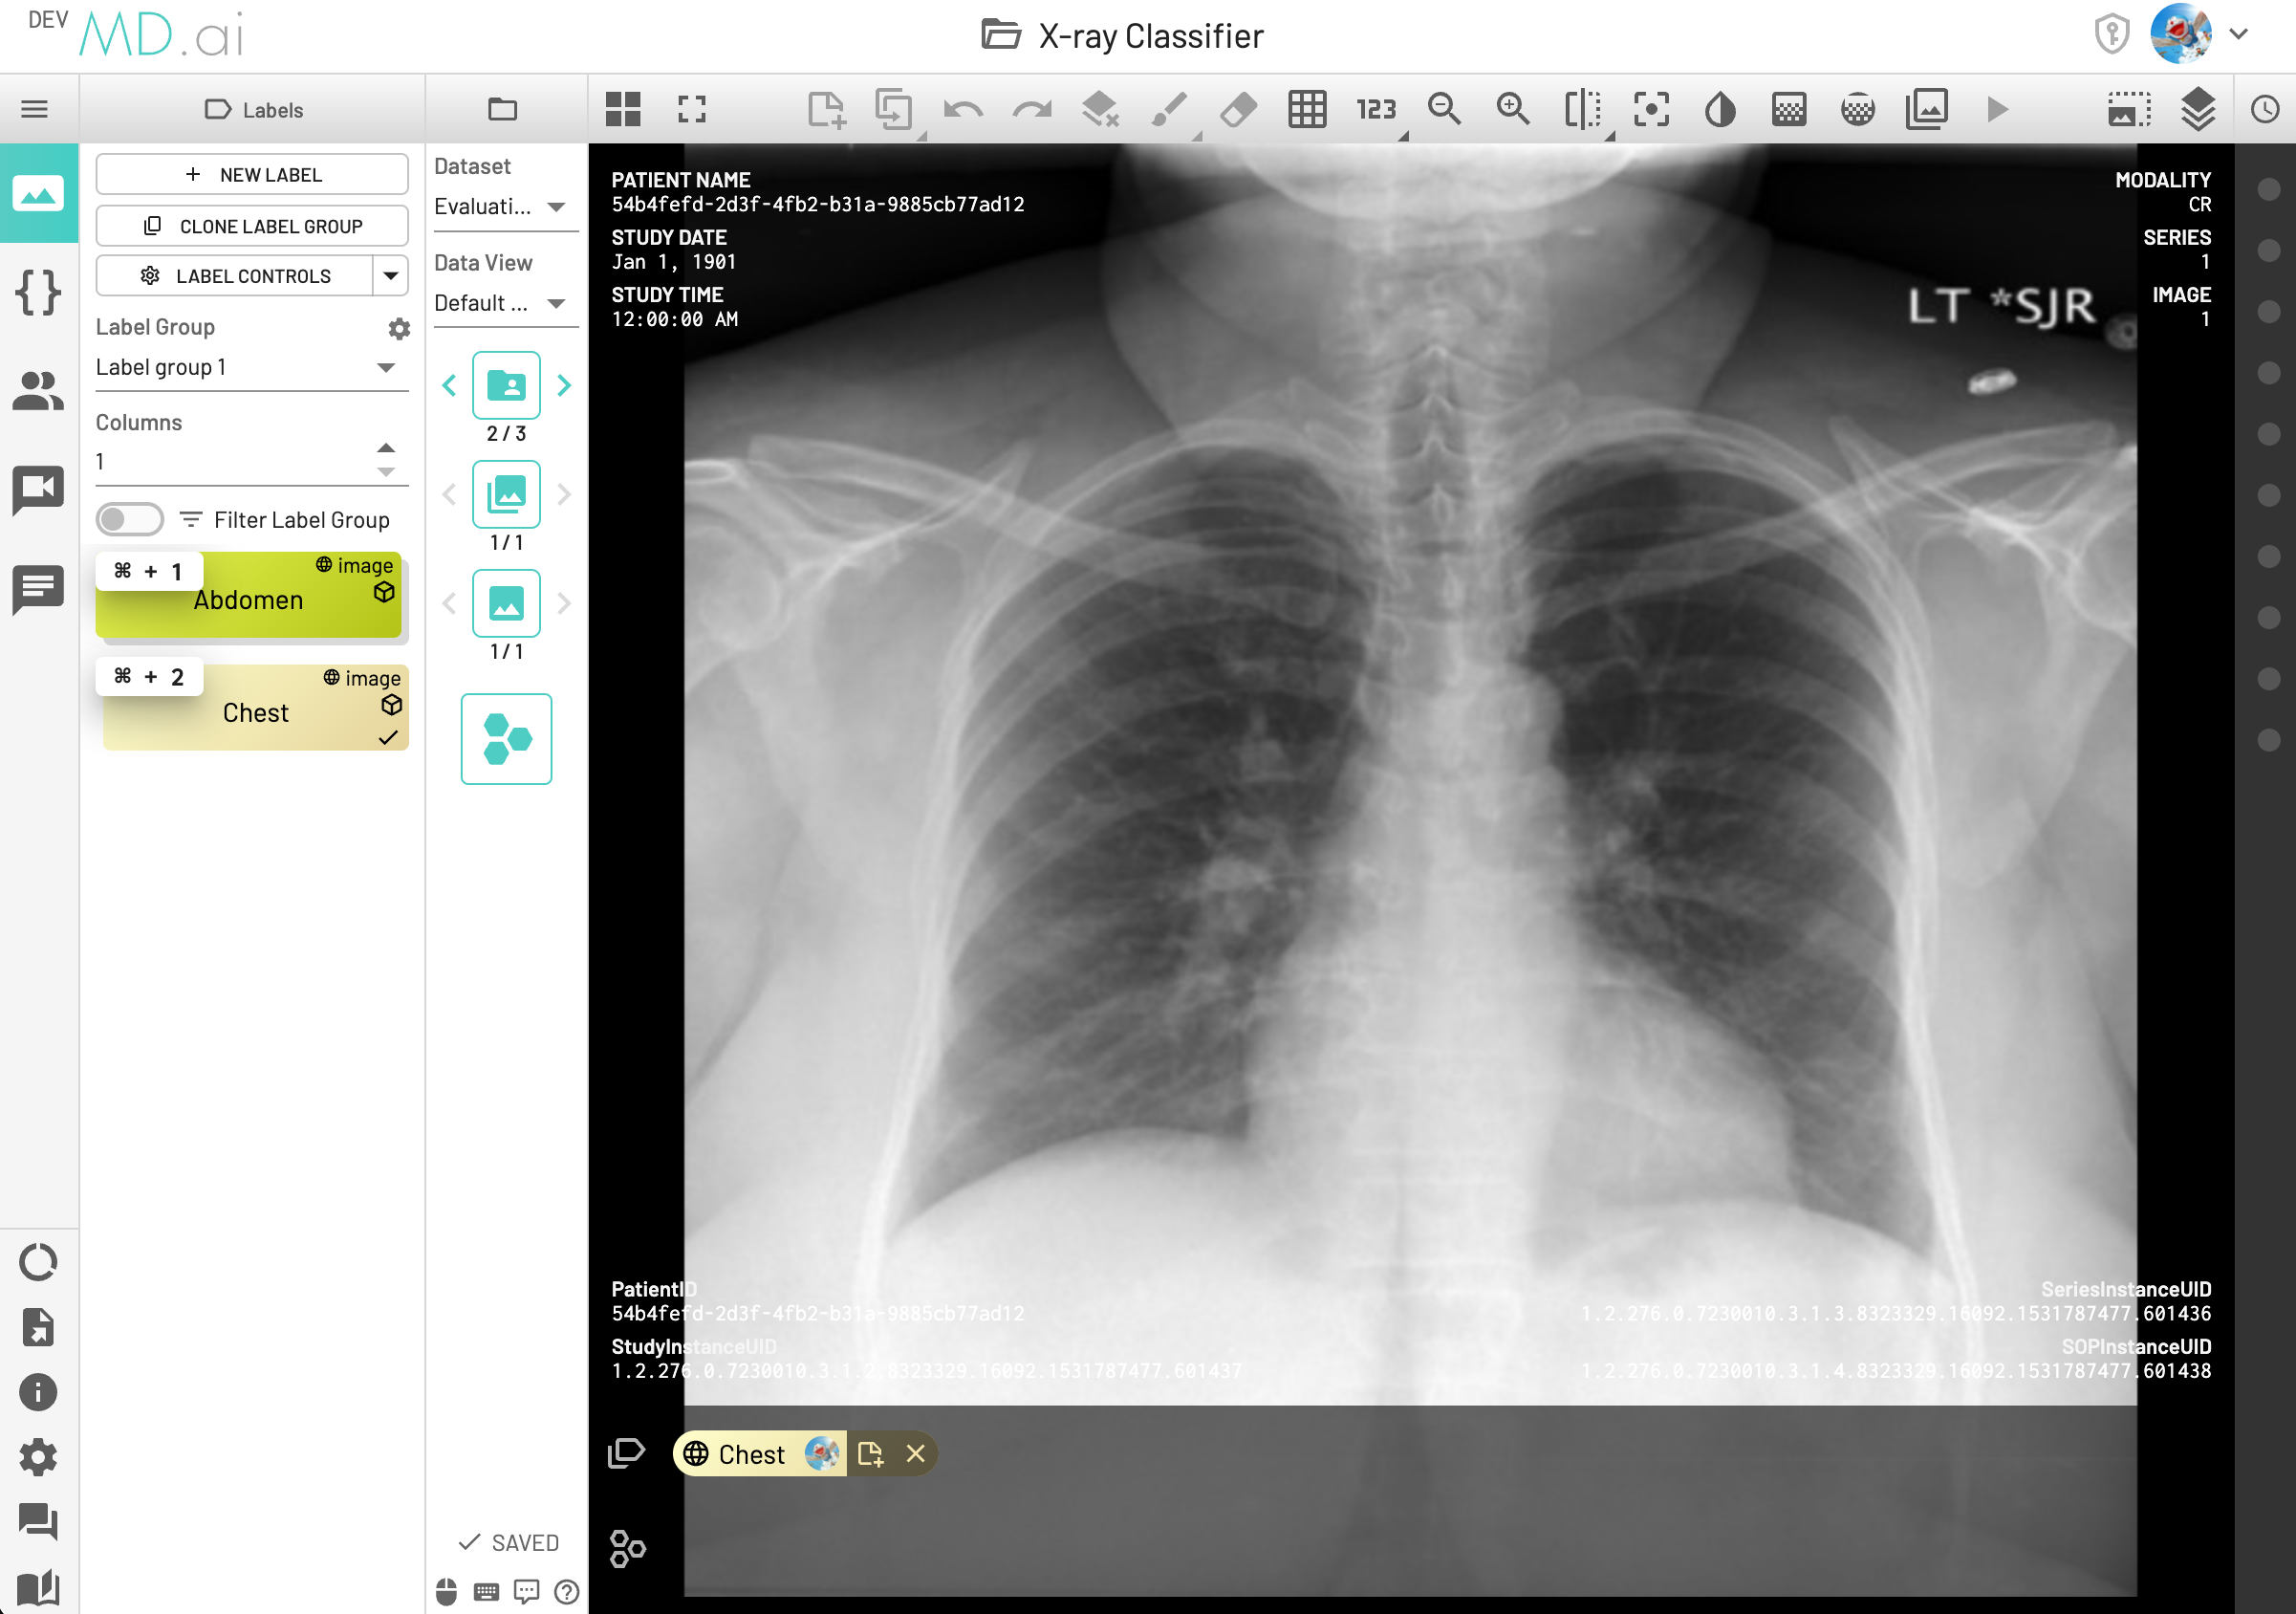
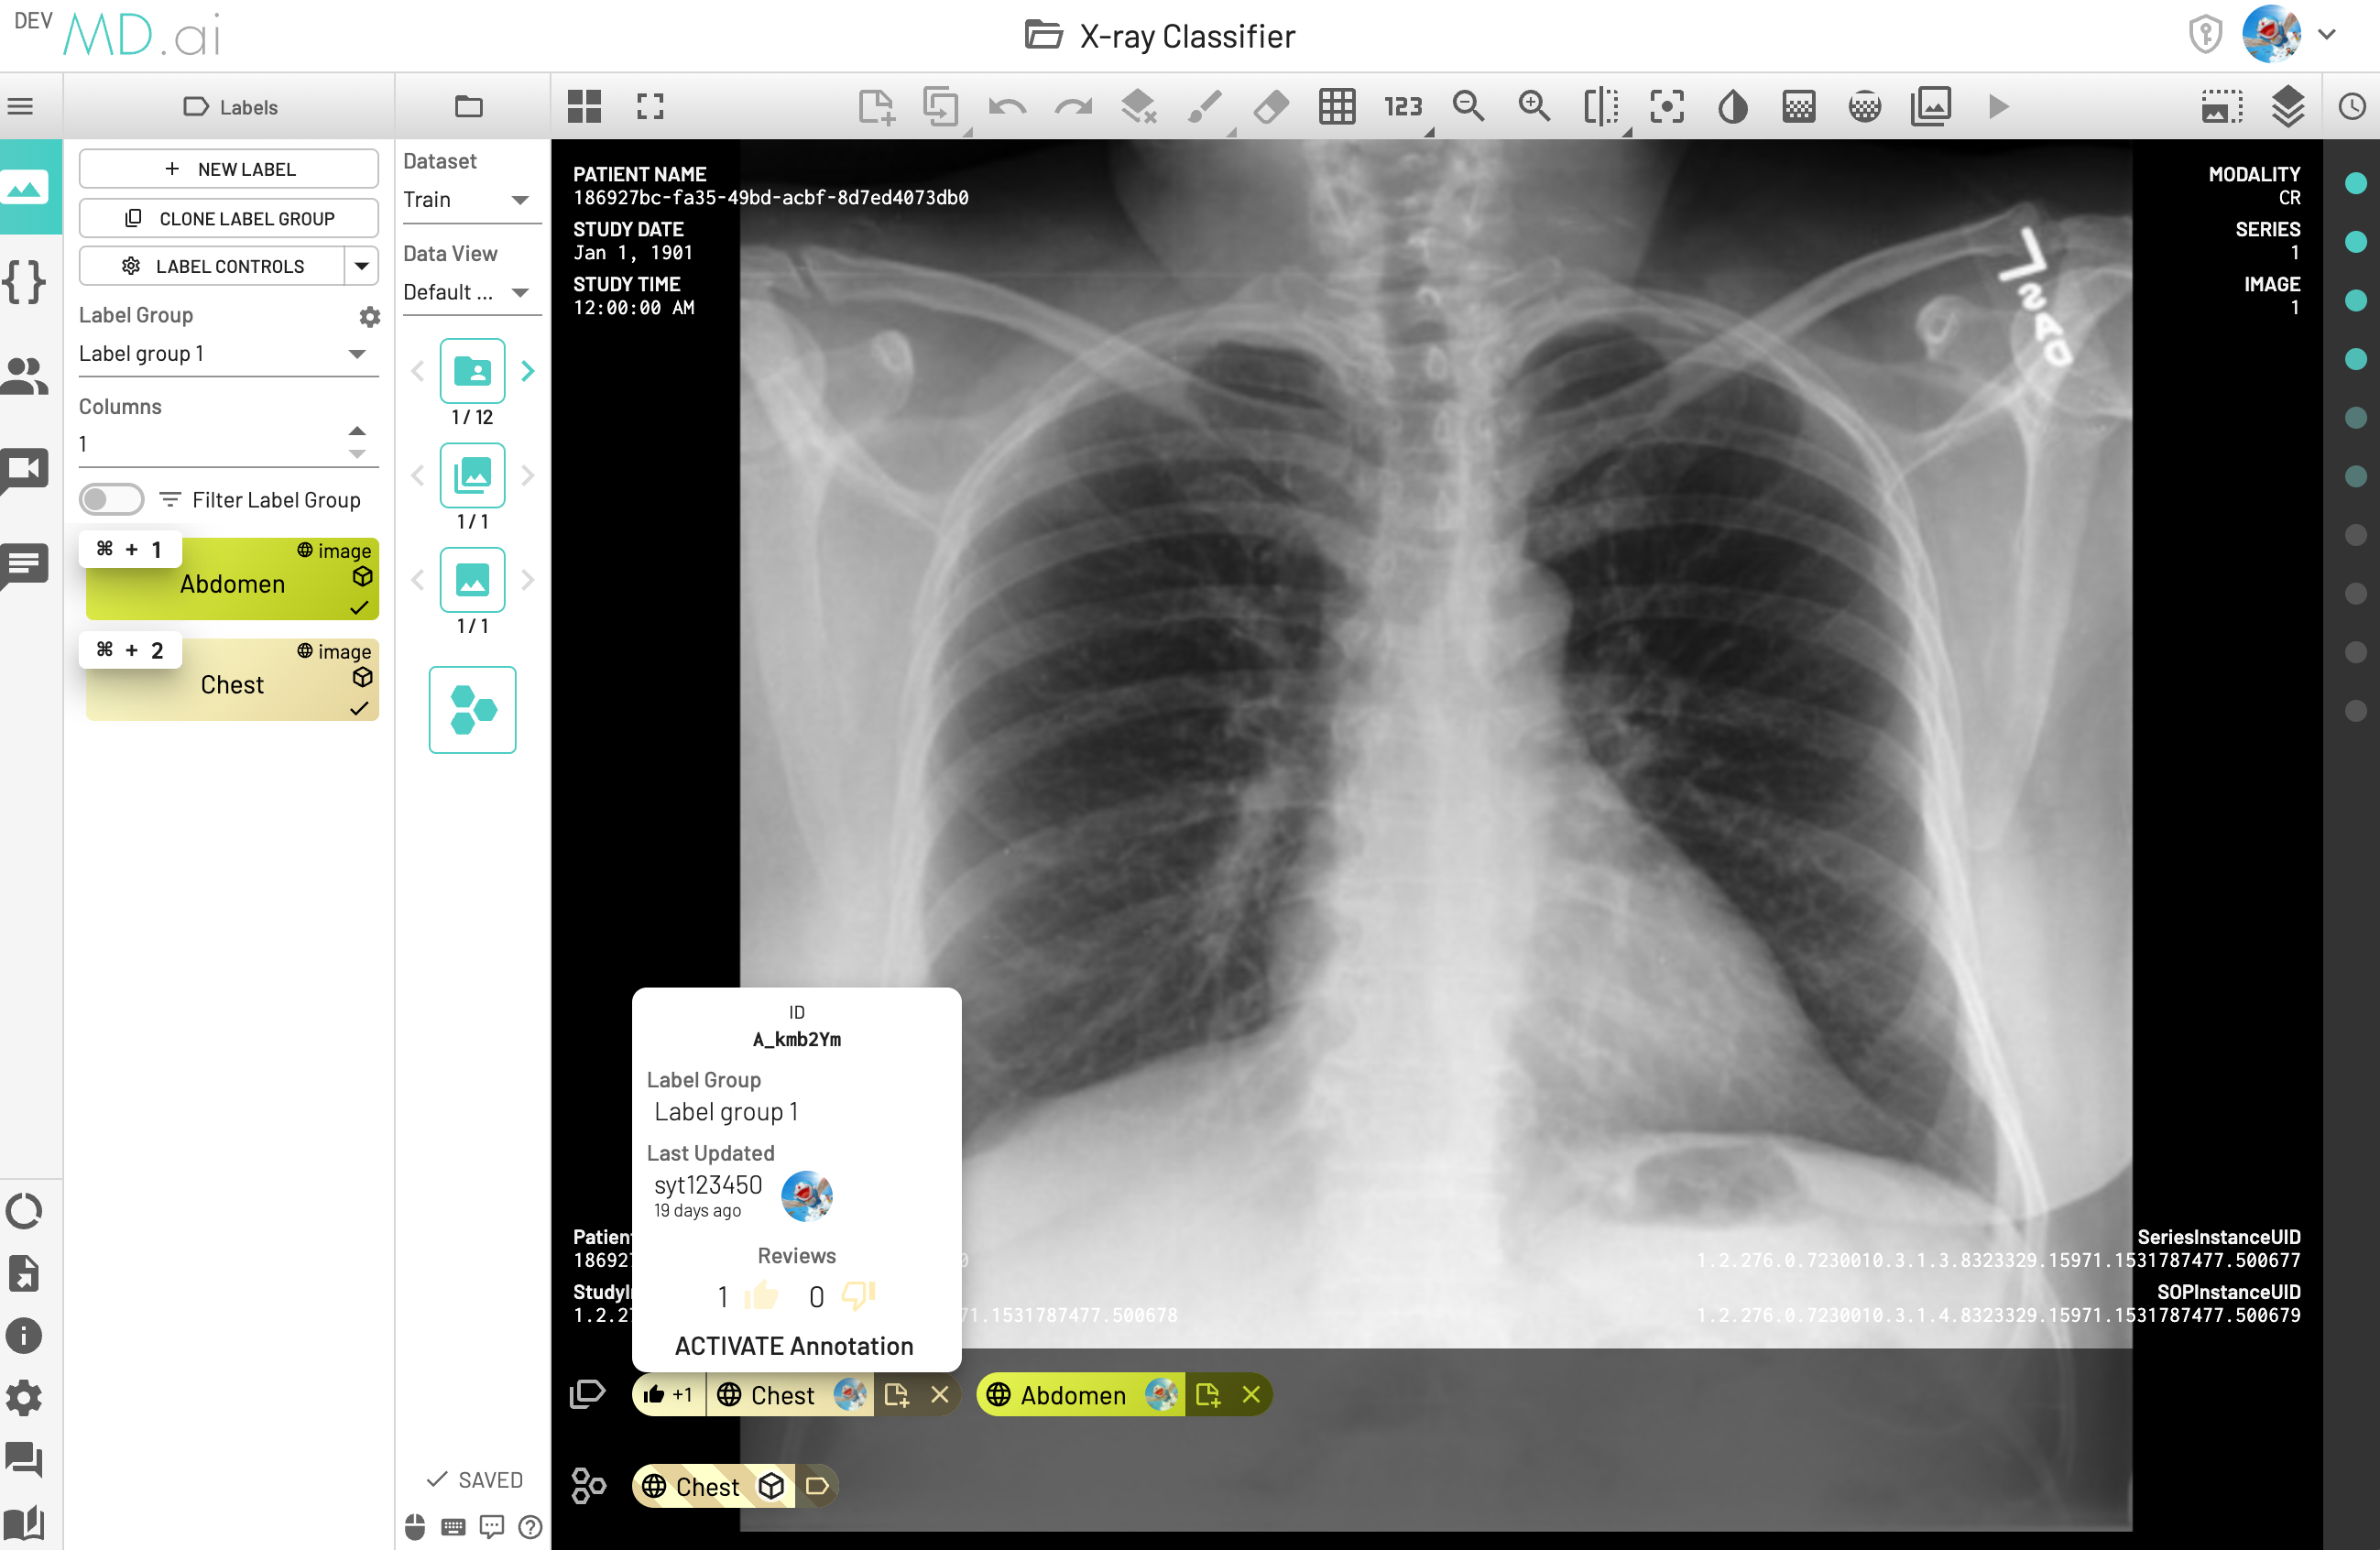
If
Creditof annotations are different, pick the annotation has higher credit (in the following screenshot, annotationChesthas more thumbs up than annotationAbdomen), and the Credit takes precedence over previousLatestrule, which means although theAbdomenis the latest, the instance would still be labeled asChestand counted asTrue Positive (TP).
Annotation Credit Calculation
Credit is defined as the number of thumbs up and thumbs down annotations by users for the particular label.
- Start with
0 - One thumbs up (👍)
+1 - One thumbs down (👎)
-1
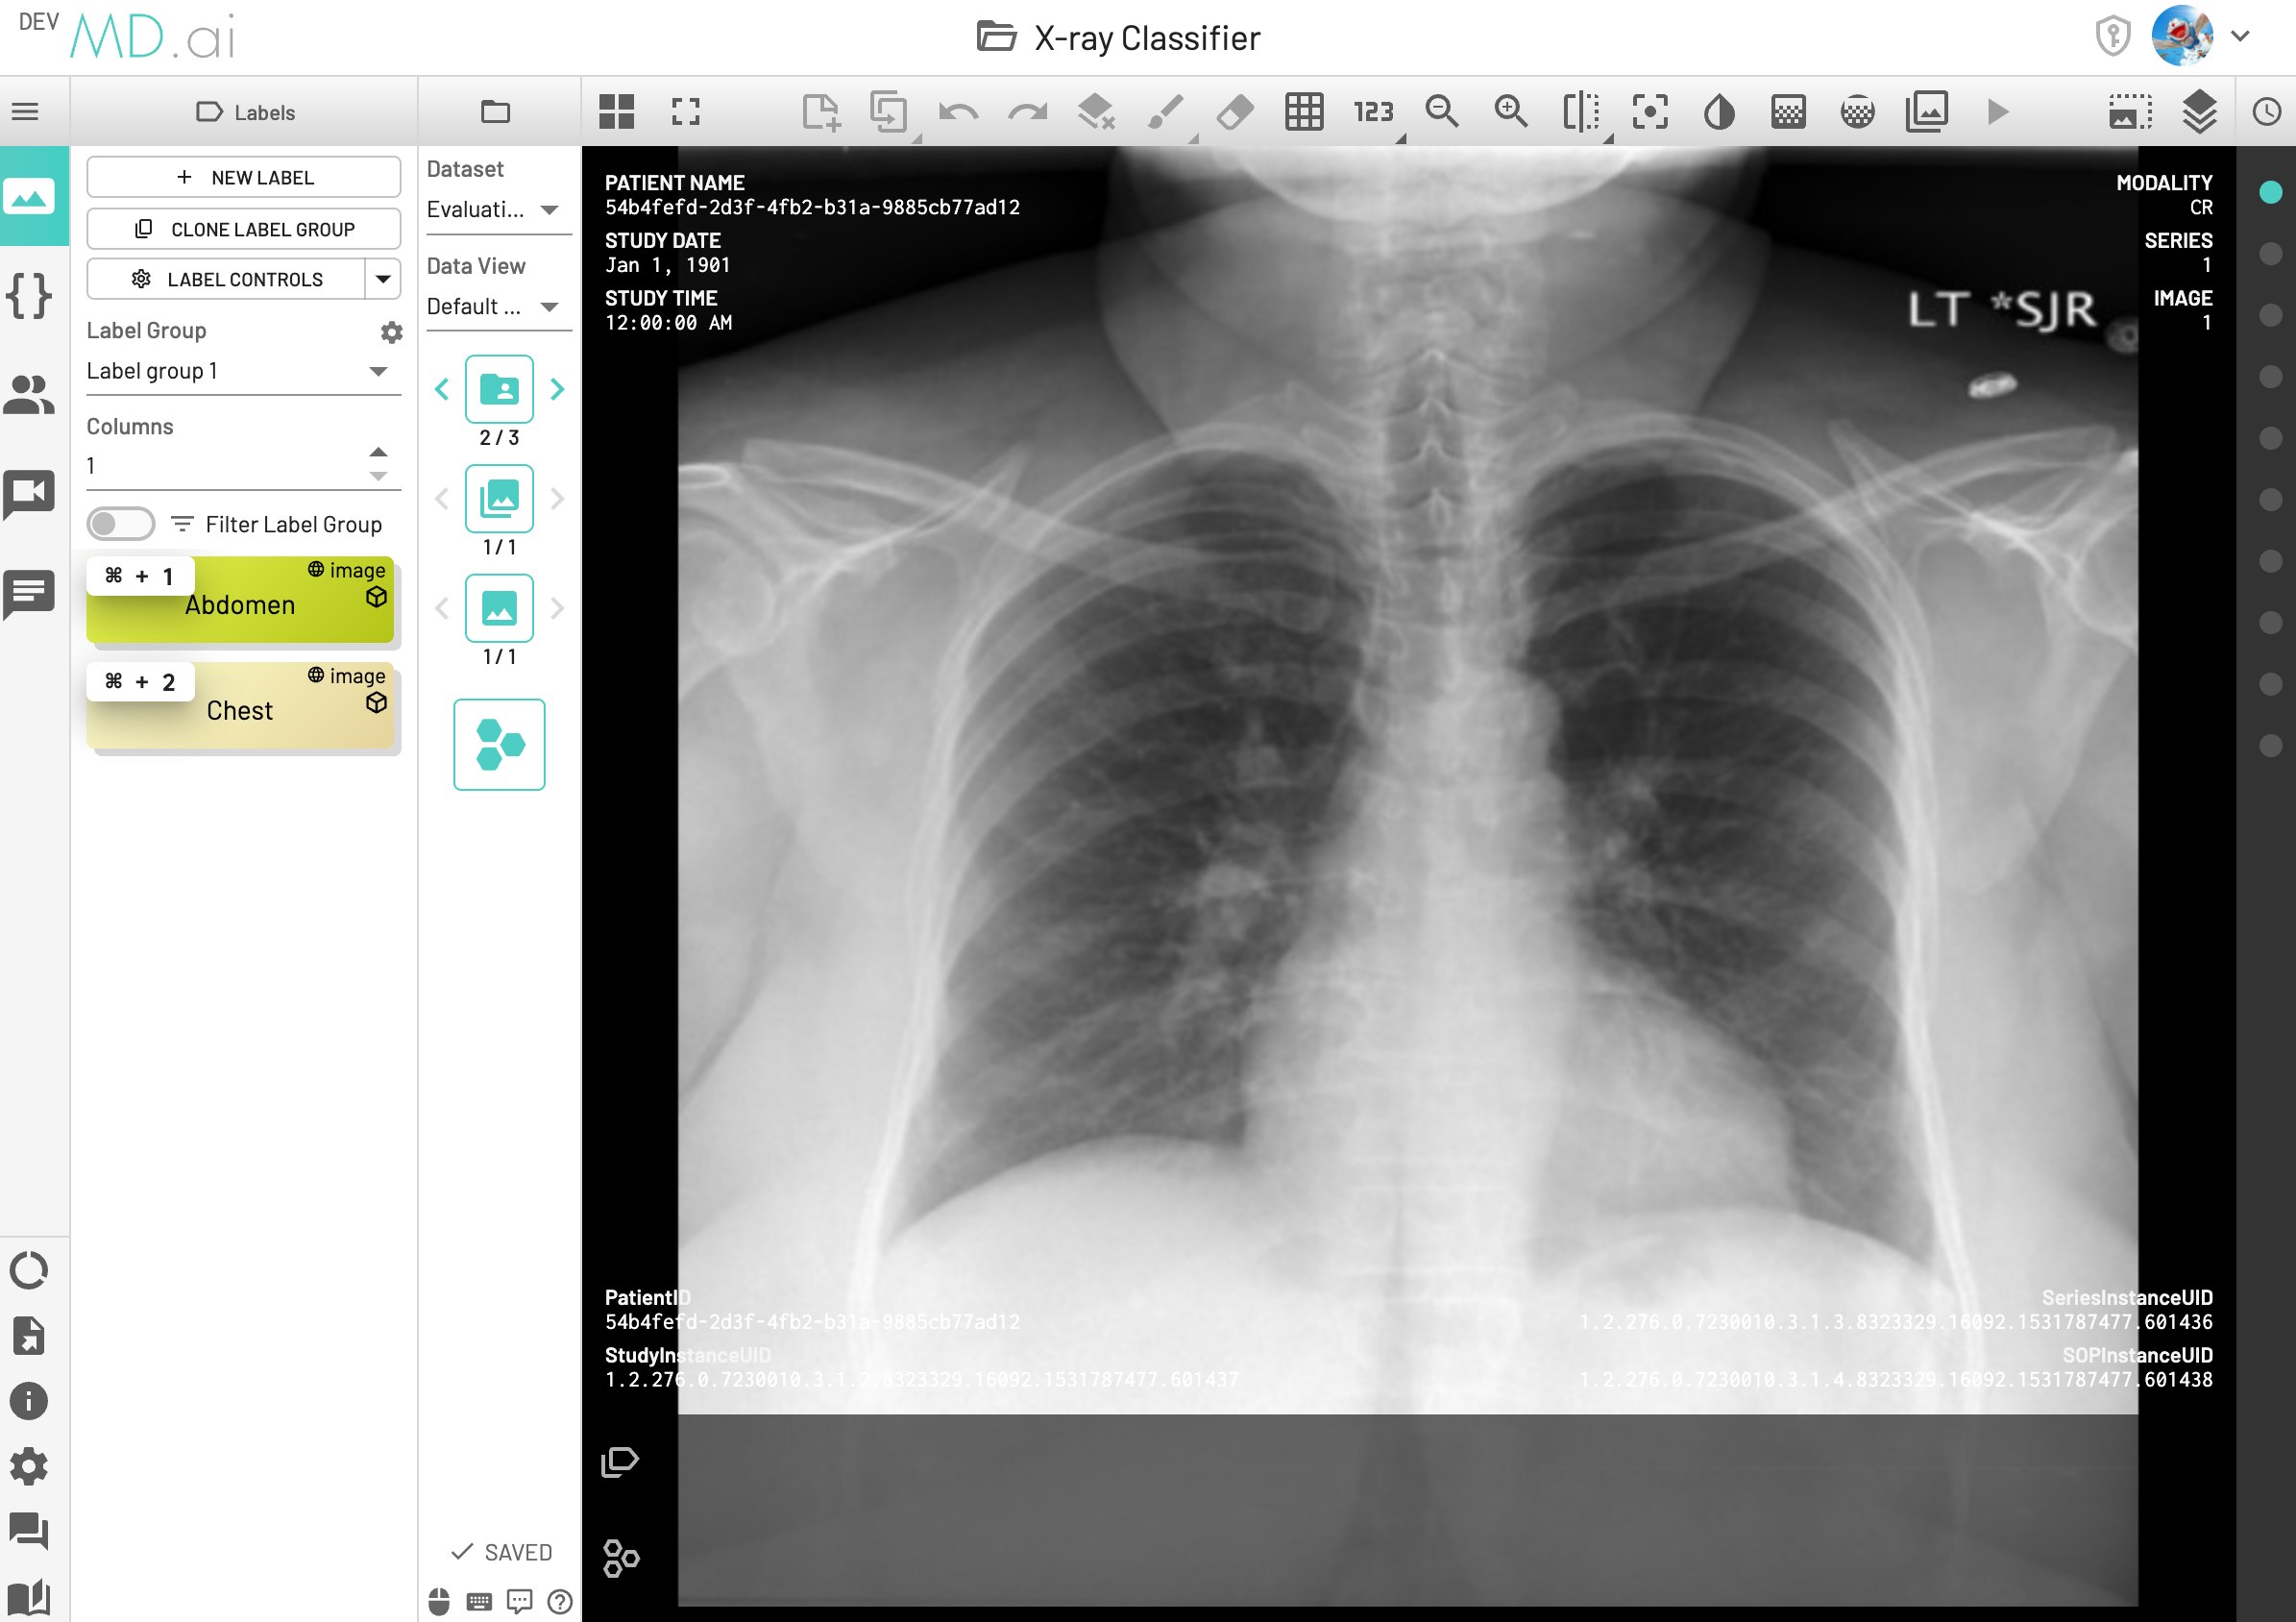
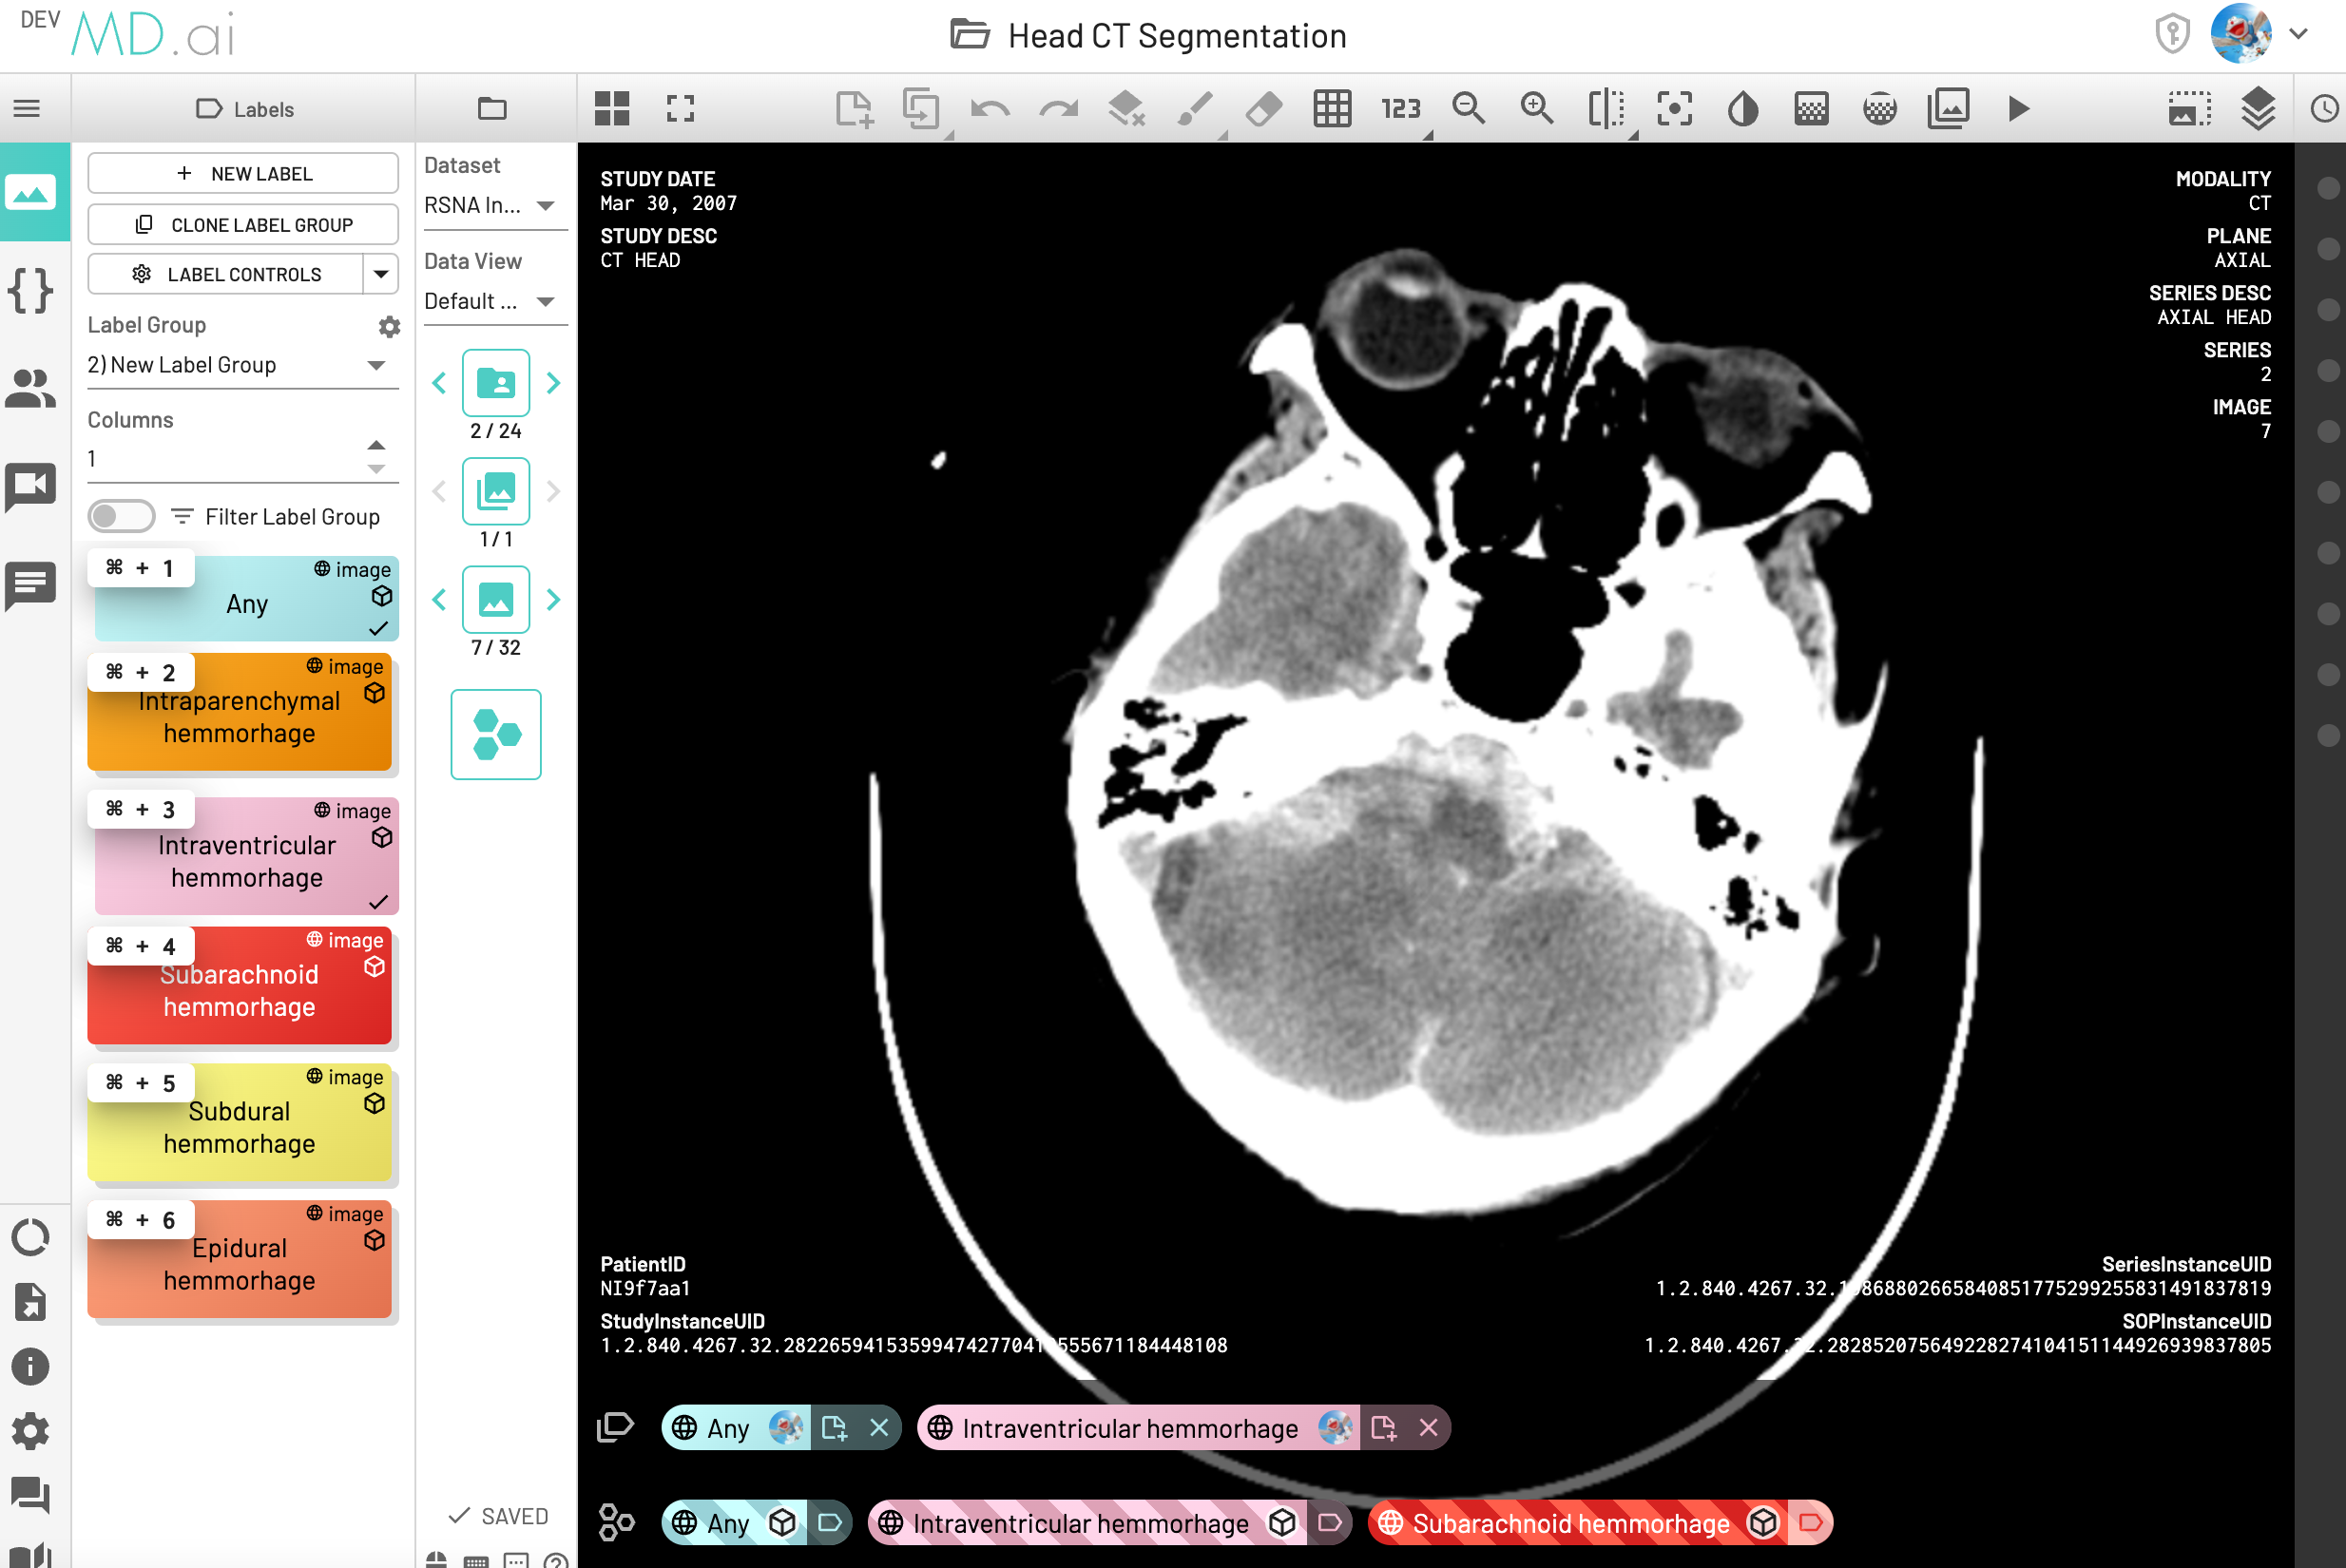
For Multi-outputs Classification Model, all annotations would be used to calculate model performance. In the following screenshot, the model has 3 model outputs, and 2 annotations on the active instance, so the metric for this instance would be: Any - TP, Intraventricular hemmorhage - TP, Subarachnoid hemmorhage - FP
Definition of Multi-outputs Classification Model
The model is classification based and at least one resource in the project has two or more model outputs from one model task.